
HP XP P9000Watch and HP XP P9000Sketch Reference Guide for HP XP P9000 Performance Advisor v5.5 (T1789-96341, February 2013)
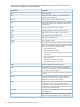
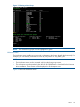

Viewing Sync/Async metrics
To view the Sync/Async metrics for P-VOLs and S-VOLs:
1. Start HP XP P9000Watch. The Array menu appears.
2. Select the array whose performance you want to monitor, and then press the Enter key. The
following list of host group options connected to the array is displayed:
• 1 Sync/Async Metrics
• 2 CA Journal Metrics
• 3 Host Group Metrics
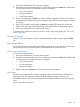
3. Select 1, and then press the Enter key. The list of LDEVs configured as P-VOLs and S-VOLs in
the selected XP or P9000 disk array is displayed.
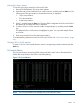
4. To select a P-VOL or S-VOL, enter the number corresponding to it, and then press the Enter
key.
The selected P-VOL or S-VOL record is highlighted in green. You can select multiple P-VOLs
and S-VOLs.
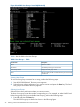
5. Enter c to proceed and view the performance metrics.
To understand the performance metrics for P-VOLs and S-VOLs, see “Sync/Async Metrics” (page
42).
Clearing P-VOL or S-VOL selection
To clear a P-VOL or S-VOL record selection, enter its corresponding number, and then press the
Enter key.
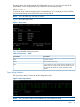
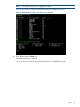
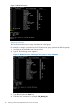
CA Journal Metrics
The CA Journal metrics screen lists all the configured P-VOLs and S-VOLs in the selected XP or
P9000 disk array based on the CTGs to which they belong.
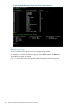
Figure 7 CA Journal Metrics
NOTE: The CA Journal Metrics are available only in the Interactive mode
Menus 23