
HP StorageWorks P9000 Performance Advisor Software v5.4 Troubleshooting and FAQs Guide (T1789-96336, April 2012)

-----------------------------------------------------------------------------------------------------
PerformanceAdvisor: ERROR: Can't attach to command device: \\.\PHYSICALDRIVE65
One of the following may be the reasons:
*The device with GUID is formatted using Windows
*The command device switch is turned off accidentally
*Host cannot access the command device (Either security settings in the array allow the host to see the command device or the SAN connectivity is lost)
In P9000 Performance Advisor, if the data collection interval is set to 5 minutes,
will the data point received be the average value in 5 minutes or just the value
at the point of time, such as the 10:00?
All the values in P9000 Performance Advisor that do not require any calculation are values in point
of time, such as the maximum and minium values. The average value will be over a collection period.
P9000 Performance Advisor real-time charting
NOTE:
The real-time charting feature is available in P9000 Performance Advisor from v4.5 onwards.
Therefore, the following FAQs are not applicable to P9000 Performance Advisor versions prior to
v4.5.
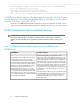
How is P9000 Performance Advisor real time charting different from
P9000Watch?
Real-time chartingP9000Watch
Real-time data charting is integrated into P9000
Performance Advisor and applicable for the P9000 disk
arrays, such as the P9500 and for the following XP disk
array models: XP24000 and XP12000. It enables P9000
Performance Advisor to collect performance data for the
above-mentioned array types through the associated host
agents. The collection frequency depends on the number
of components selected and the load on the XP or the
P9000 disk array. For a minimum XP or P9000 disk array
configuration, the collection frequency can be as low as
five seconds.
Through real-time charting, you can view real-time metrics
collected for RAID groups or LDEVs that belong to an XP
or a P9000 disk array. At a time, you can monitor a
maximum of five RAID groups or LDEVs in an XP or a
P9000 disk array.
P9000Watch can be installed and used only on
a P9000 Performance Advisor host agent.
P9000Watch provides the metrics related to one
or many WWNs, each of which can be selected.
The metrics display information related to CPU,
RAID group, port, Ldev and DKC without giving
any direct association between them. The
minimum collection frequency is 10 seconds.
P9000Watch allows you to monitor any number
of components and is applicable for all XP and
P9000 disk arrays. You can use P9000Sketch to
view and also graphical representation of the data
obtained from P9000Watch.
Frequently Asked Questions70