
HP StorageWorks P9000 Performance Advisor Software v5.2 User and Troubleshooting Guide (T1789-96315, June 2011)
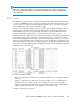
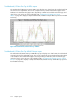
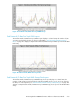
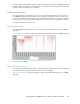
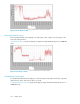
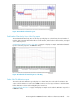
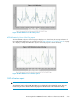
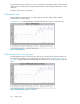

Figure 41 Total Backend I/O Rate First Top 8 RAID Groups
.
Total Frontend I/O Rate First Top 8 LDEVs report
The Total Frontend I/O Rate First Top 8 LDEVs report displays in a chart format, the number of I/Os
operations performed by the first set of busiest eight LDEVs. “Total Frontend I/O Rate First Top 8
Ldevs” on page 413 displays a sample Total Frontend I/O Rate First Top 8 LDEVs report for the XP1024
Disk Array.
Figure 42 Total Frontend I/O Rate First Top 8 Ldevs
.
Total Frontend I/O Rate First Top 8 RAID Groups/Pools report
The Total Frontend I/O Rate First Top 8 RAID Groups/Pools report displays in a chart format, the
number of I/O operations performed by the eight busiest RAID groups or pools. Pools can either be
the ThP pool or the snapshot pool. “Total Frontend I/O Rate First Top 8 Array Groups” on page 414
displays a sample Total Frontend I/O Rate First Top 8 RAID Groups/Pools report for the XP1024 Disk
Array.
HP StorageWorks P9000 Performance Advisor Software User Guide 413