
HP StorageWorks P9000 Performance Advisor Software v5.2 User and Troubleshooting Guide (T1789-96315, June 2011)
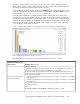

Using chart controls
After a performance graph is plotted in the Chart Work Area, you can perform the following tasks
using the controls provided in the top and bottom pane of the Chart Work Area.
• “Adding new chart windows” on page 304
• “Saving charts as PDF files” on page 304
• “Saving favorite charts” on page 305
• “Loading favorite charts” on page 306
• “Forecasting utilization” on page 311
• “Using date and time filters” on page 313
• “Using chart Styles” on page 313
• “Printing charts” on page 309
• “Changing the Chart Work Area layout” on page 309
• “Viewing current LDEV assignments for an MP blade” on page 310
• “Previewing charts” on page 315
• “Zooming in on data points across performance graphs” on page 316
• “Rearranging or moving chart windows” on page 317
• “Removing chart windows” on page 318
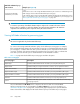
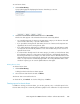
Adding new chart windows
By default, the performance graphs of components for metrics that belong to the same metric category
are plotted in the same chart window. To view performance graphs of components in separate chart
windows:
1. Clear the selection (blue border) around the existing chart window by clicking the title bar of the
active chart window.
The blue border around the chart window should look disabled.
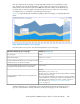
2. Click Add New to add a new chart window. The new chart window is automatically selected
(blue border appears around the active chart window).
The performance data points of components that you select in the component selection tree for
metrics in the same metric category are added to the new chart window till you clear the selection.
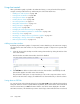
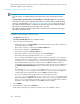
Saving charts as PDF files
You can save charts in the Chart Work Area by clicking Save as PDF, where individual chart windows
having the charts are saved as separate PDF files. By default, all the chart windows in the Chart Work
Area are selected. Hence, P9000 Performance Advisor saves all the charts displayed in the Chart
Work Area. However, if the charts that you want to save belong to chart windows that are not selected:
Using charts304