
HP StorageWorks P9000 Performance Advisor Software v5.2 User and Troubleshooting Guide (T1789-96315, June 2011)
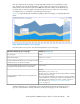
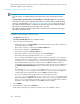
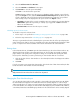

Each area represents the percentage of average MP blade utilization by an individual processing
type. The X-axis represents the duration that you select and the Y-axis represents the average MP
blade utilization. The chart title includes the P9000 disk array DKC number, the MP blade ID, and
the metric name for which the graph is plotted. The legends on the top right corner of the stacked
area graph help you to identify the corresponding processing types.
Figure 26 on page 303 displays a stacked area graph for the processing types served by the MPB-1MA
blade.
Figure 26 MP blade utilization - Processing types
.
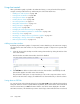
Place the pointer over an area to view the following details for a processing type:
Example (see Figure 26)MP blade utilization by processing types
SystemProcessing type
08/12/10, 10:36:36Date and time stamp
3.12%
Average MP blade utilization by a processing type (average
from the previous to the current time stamp)
Total: 19.02%
Average MP blade utilization by all the processing types
associated with the MP blade for the overall duration
(16.4%)
Calculated as (3.12 / 19.02) * 100
The value 16.4% in 19.02% indicates the average utilization contributed
by the System processing type.
The 16.4% average utilization by the System processing type is further
contributed by the associated top 20 consumers. It indicates that 16.4%
of the CPU cycles are utilized to process the consumers requests. For
more information, see “Viewing top 20 consumers of an MP
blade” on page 300.
Average MP blade utilization by a processing type for the
overall duration
The above data helps you to understand the extent of an MP blade utilization by a particular processing
type when compared to the average utilization by all the processing types for the overall duration.
HP StorageWorks P9000 Performance Advisor Software User Guide 303