
HP StorageWorks P9000 Performance Advisor Software v5.2 User and Troubleshooting Guide (T1789-96315, June 2011)

DescriptionSections
The Chart controls section displays common controls or buttons
used to perform specific tasks on charts, such as the following:
• Add a new chart window.
• Save charts as favorites and load the favorite charts.
• Save charts as PDF files.
• Print charts.
• Change the Chart Work Area layout.
• Update charts with the latest data points.
• Select all the chart windows in the Chart Work Area.
• Remove charts from the Chart Work Area.
• View performance graphs of components for a duration of your
choice.
• Forecast the DKA, MP, cache write pending, RAID group, and
ThP pool utilization for an XP disk array.
Forecast the MP blade, cache write pending, RAID group, and
ThP pool utilization for a P9000 disk array.
• View the last 10 performance data points for components.
• View graphs using the different chart styles.
• View or hide the legends, zoom preview panel, and the data
points.
• View the LDEVs that are currently assigned to MP blades.
For more information, see “Using chart controls” on page 304.
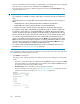
Chart controls
You can zoom on the performance data points for a specified
duration. You can use the Zoom preview panel that provides a
preview to the performance data displayed in the selected chart
window. You can also zoom on the data points directly in a chart
window.
For more information, see “Previewing charts” on page 315 and
“Zooming in on data points across performance
graphs” on page 316.
Zoom in and zoom out on data points
Tasks you can perform on the Charts screen
• “Plotting charts” on page 261
• “Viewing charts” on page 297
• “Using chart controls” on page 304
• “Zooming in on charts” on page 315
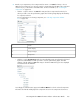
Plotting charts
NOTE:
The figures in the following procedure are an example for the XP disk array metric selection.
Prerequisite
Ensure that the following prerequisites are met before you navigate to the Charts screen:
HP StorageWorks P9000 Performance Advisor Software User Guide 261