
HP StorageWorks P9000 Performance Advisor Software v5.2 User and Troubleshooting Guide (T1789-96315, June 2011)
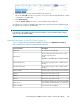

DescriptionScreen elements
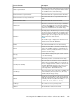
The random frontend I/O read write values.Random Writes – Frontend
The sequential frontend I/O read cache hit values.Sequential Read Cache Hits – Frontend
The sequential frontend I/O read values.Sequential Reads – Frontend
The sequential frontend I/O write values.Sequential Writes – Frontend
The sequential frontend reads throughput in MB/s for
the LDEV.
Sequential MB Reads – Frontend
The sequential frontend writes throughput in MB/s for
the LDEV.
Sequential MB Writes – Frontend
The sequential frontend write cache hit values in per
second.
Sequential Write Cache Hits – Frontend
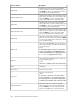
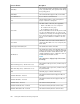
The identification number of the subsystem.SS ID
The SLPR group ID.
NOTE:
SLPR does not exist in the P9000 disk arrays. So,
the SLPR group ID is displayed only for the XP disk
arrays.
SLPR
The LUN associated with the given LDEV.Target LUN
The volume group identification name if the device is
associated with a volume group. P9000 Performance
Advisor reports volume groups from LVM (an HP
brand) and VXVM (a Veritas brand).
Vol. Group
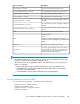
NOTE:
• The E-LDEV, Ext-LUN, E-Port(s), E-Seq, Jnl Group, and Vol. Group are available for selection only
if they are configured in the selected XP or P9000 disk array.
• The following metrics are not applicable for the XP or the P9000 continuous access journal pool
LDEVs. NA is displayed:
• Response Time Metric category: Maximum Write Response and Average Write Response
• Frontend IO Metric category: Random Write Cache Hits, Random Writes, Sequential Write
Cache Hits, and Sequential Writes
• Frontend MB Metric category: Random MB Writes and Sequential MB Writes
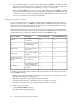
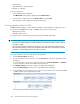
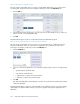
Viewing comparison charts for LDEVs
You can compare the performance of an LDEV for the following metrics:
• Random read hits vs. Random read miss
• Random read vs. Random write
• Sequential read hits vs. Sequential read miss
• Read hits vs. Read miss
HP StorageWorks P9000 Performance Advisor Software User Guide 247