
HP StorageWorks P9000 Performance Advisor Software v5.2 Release Notes (T1789-96318, August 2011)

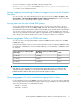
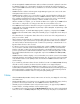
Table Of Contents
- HP StorageWorks P9000 Performance Advisor Software Release Notes
- Description
- Supported XP and P9000 disk arrays and firmware versions
- Operating systems and JRE requirements
- Languages
- New features
- Enhancements
- Installing Performance Advisor
- Upgrading Performance Advisor
- Points to note
- Fixes
- Notes
- Related documentation
- P9000 Performance Advisor supported versions statement
To receive notifications, configure the SMTP notification settings in the
PAMonitor_mail.properties file available in the <Install_Drive>:\HPSS\paMonitor\
conf folder on your management station.
Starting, stopping, and restarting Windows host agent services from the Windows
Start menu
You can now start, stop, and restart Windows host agent services from the Start > Programs > HP
Storage Works > HP StorageWorks P9000 Performance Advisor Host Agent menu on your host system.
The real-time service is accordingly started, stopped, or restarted.
Viewing report on the most utilized RAID groups
A new report called the RAID Group Utilization report is introduced to provide data on the most
utilized RAID groups in an XP or a P9000 (P9500) disk array. The utilization of each RAID group is
derived based on the backend transfers addressed by the RAID group and indicates the total utilization
over an entire collection interval. You can view the report for 8 - 32 busiest RAID groups and each
chart in the report displays the utilization graphs for eight RAID groups. If a RAID group is associated
with a ThP pool, the extent of utilization due to I/Os occurring on a ThP pool is considered.
Removing aggregate TB-Days for P9000 disk arrays
You can now remove the aggregate TB-Days installed in P9000 Performance Advisor for a P9000
(P9500) disk array.
In the following example, when you remove Meter based Term license for 53036 (P9500 disk array),
the aggregate 115TB-Days are removed. Individual TB-Days, such as 5TB-Days or 10TB-Days cannot
be removed:
Status
Available Capacity for 53036 (P9500
disk array)
License Capacity for 53036 (P9500
disk array)
Active10TB-Days100 TB-days
Active5TB-Days100 TB-days
Active100TB-Days100TB-Days
IMPORTANT:
If the TB-Days count is negative, the removal of the Meter based Term license is not allowed. If the
aggregate capacity is 0TB-Days, you can still remove the Meter based Term license. In such a case,
P9000 Performance Advisor enters grace period and starts negative counting.
Showing aggregate I/Os at an individual host group level in Charts
For an individual host group in the Charts component selection tree, you can now view the aggregate
of the average I/Os from each LDEV belonging to that host group. In addition, the following two new
metrics are introduced for every individual host group:
• Total IO/s – Frontend
• Total MB/s – Frontend
HP StorageWorks P9000 Performance Advisor Software Release Notes 5