
HP StorageWorks XP24000/XP20000 Performance Control User Guide (T5214-96087, September 2010)
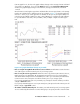


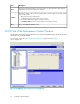

I/O rate graph for 1A, the line in the graph indicates changes in the average I/O rate calculated
every minute (see Graph 2). If you select the Detail check box in the Performance Management
windows, the graph displays changes in the maximum, average, and minimum I/O rates at
1–minute.
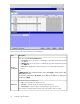
XP Performance Control applies upper limits and thresholds to the average I/O rate or the average
transfer rate calculated every gathering interval. For example, in Figure 2 in which the gathering
interval is 1 minute, if you set an upper-limit of 150 IO/s for the port 1A, the highest data point
in the line CL1-A in Graph 2 and the line Ave.(1 min) in Graph 3 is somewhere around 150 IO/s.
It is possible that the lines Max.(1 min.) and Min.(1 min.) in Graph 3 might exceed the upper-
limit.
Figure 2 Line graphs that indicate changes in port traffic
.
• Note on using HP StorageWorks XP Continuous Access Software: XP Performance Control monitors
write I/O requests issued from initiator ports of your storage system.
• Note on using the remote copy functions: When the remote copy functions (XP Continuous Access,
Hitachi TrueCopy™ for Mainframe, HP StorageWorks XP Continuous Access Journal Software,
and Hitachi Universal Replicator™ for Mainframe) are used in your environment, XP Performance
Control monitors write I/O requests issued from initiator ports of your storage system.
If you specify an RCU target port as a prioritized port, I/O requests from the initiator port will be
a target of threshold control.
If you specify an RCU target port as a non-prioritized port, I/O requests from the initiator port will
not be a target of upper-limit control.
• The statistics of Initiator/External ports: The initiator ports and external ports of your storage system
are not controlled by XP Performance Control. Although you can specify Prioritize or Non-Prioritize
XP24000/XP20000 Performance Control User Guide 13