
HP XC System Software Administration Guide Version 4.0

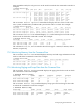
Table Of Contents
- XC Administration Guide
- Table of Contents
- About This Document
- 1 HP XC Administration Environment
- 1.1 Understanding Nodes, Services, and Roles
- 1.2 File System
- 1.3 HP XC Command Environment
- 1.4 Configuration and Management Database
- 1.5 HP XC Configuration File Guidelines
- 1.6 Installation and Software Distribution
- 1.7 Improved Availability
- 1.8 Networking
- 1.9 Modulefiles
- 1.10 Security
- 1.11 Recommended Administrative Tasks
- 2 Improved Availability
- 3 Starting Up and Shutting Down the HP XC System
- 4 Managing and Customizing System Services
- 4.1 HP XC System Services
- 4.2 Displaying Services Information
- 4.3 Restarting a Service
- 4.4 Stopping a Service
- 4.5 Global System Services
- 4.6 Customizing Services and Roles
- 4.6.1 Overview of the HP XC Services Configuration
- 4.6.2 Service Configuration Sequence of Operation
- 4.6.3 Assigning Roles with the cluster_config Utility
- 4.6.4 The *config.d Directories
- 4.6.5 Configuration Scripts
- 4.6.6 Understanding Global Configuration Scripts
- 4.6.7 Advance Planning
- 4.6.8 Editing the roles_services.ini File
- 4.6.9 Creating a service.ini File
- 4.6.10 Adding a New Service
- 4.6.11 Verifying a New Service
- 5 Managing Licenses
- 6 Managing the Configuration and Management Database
- 6.1 Accessing the Configuration and Management Database
- 6.2 Querying the Configuration and Management Database
- 6.3 Finding and Setting System Attribute Values
- 6.4 Backing Up the Configuration Database
- 6.5 Restoring the Configuration Database from a Backup File
- 6.6 Archiving Sensor Data from the Configuration Database
- 6.7 Restoring the Sensor Data from an Archive File
- 6.8 Purging Sensor Data from the Configuration and Management Database
- 6.9 Dumping the Configuration and Management Database
- 7 Monitoring the System
- 7.1 Monitoring Tools
- 7.2 Monitoring Strategy
- 7.3 Displaying System Environment Data
- 7.4 Monitoring Disks
- 7.5 Displaying System Statistics
- 7.6 Logging Node Events
- 7.7 The collectl Utility
- 7.8 Using HP Graph To Display Network Bandwidth and System Use
- 7.9 The resmon Utility
- 7.10 The kdump Mechanism and the crash Utility
- 8 Monitoring the System with Nagios
- 8.1 Nagios Overview
- 8.2 Using the Nagios Web Interface
- 8.3 Adjusting the Nagios Configuration
- 8.4 Configuring Nagios on HP XC Systems
- 8.5 Using the Nan Notification Aggregator and Delimiter To Control Nagios Messages
- 8.6 Nagios Report Generator Utility
- 8.7 Modifying Nagios To Effect Changes
- 9 Network Administration
- 10 Managing Patches and RPM Updates
- 11 Distributing Software Throughout the System
- 11.1 Overview of the Image Replication and Distribution Environment
- 11.2 Installing and Distributing Software Patches
- 11.3 Adding Software or Modifying Files on the Golden Client
- 11.4 Determining Which Nodes Will Be Imaged
- 11.5 Updating the Golden Image
- 11.6 Propagating the Golden Image to All Nodes
- 11.7 Maintaining a Global Service Configuration
- 12 Opening an IP Port in the Firewall
- 13 Connecting to a Remote Console
- 14 Managing Local User Accounts and Passwords
- 14.1 HP XC User and Group Accounts
- 14.2 General Procedures for Administering Local User Accounts
- 14.3 Adding a Local User Account
- 14.4 Modifying a Local User Account
- 14.5 Deleting a Local User Account
- 14.6 Configuring the ssh Keys for a User
- 14.7 Synchronizing the NIS Database
- 14.8 Changing Administrative Passwords
- 14.8.1 Changing the Superuser Password
- 14.8.2 Changing the CMDB Password
- 14.8.3 Changing the Interconnect Password
- 14.8.4 Changing the Console Port Password
- 14.8.5 Synchronizing the BMC/IPMI Password for CP6000 Systems
- 14.8.6 Changing the Nagios Administrator Password
- 14.8.7 Changing the LSF Administrator Password
- 15 Managing SLURM
- 16 Managing LSF
- 16.1 Standard LSF
- 16.2 LSF with SLURM
- 16.3 Switching the Type of LSF Installed
- 16.4 LSF with SLURM Installation
- 16.5 LSF with SLURM Startup and Shutdown
- 16.6 Controlling the LSF with SLURM Service
- 16.7 Launching Jobs with LSF with SLURM
- 16.8 Monitoring and Controlling LSF with SLURM Jobs
- 16.9 Maintaining Shell Prompts in LSF Interactive Shells
- 16.10 Job Accounting
- 16.11 LSF Daemon Log Maintenance
- 16.12 Load Indexes and Resource Information
- 16.13 LSF with SLURM Monitoring
- 16.14 LSF with SLURM Failover
- 16.15 Moving SLURM and LSF Daemons to Their Backup Nodes
- 16.16 Enhancing LSF with SLURM
- 16.17 Configuring an External Virtual Host Name for LSF with SLURM on HP XC Systems
- 17 Managing Modulefiles
- 18 Mounting File Systems
- 19 Managing Software RAID Arrays
- 20 Using Diagnostic Tools
- 20.1 Using the sys_check Utility
- 20.2 Using the ovp Utility for System Verification
- 20.3 Using the dgemm Utility to Analyze Performance
- 20.4 Using the System Interconnect Diagnostic Tools
- 21 Troubleshooting
- 21.1 General Troubleshooting
- 21.2 Nagios Troubleshooting
- 21.3 Messages Reported by Nagios
- 21.4 System Interconnect Troubleshooting
- 21.5 Improved Availability Issues
- 21.5.1 How To Start HP Serviceguard When Only the Head Node is Running
- 21.5.2 Restart Serviceguard Quorum Server if Quorum Server Node is Re-imaged
- 21.5.3 Known Limitation if Nagios is Configured for Improved Availability
- 21.5.4 Network Restart Command Negatively Affects Serviceguard
- 21.5.5 Problem Failing Over Database Package Under Serviceguard
- 21.6 SLURM Troubleshooting
- 21.7 LSF Troubleshooting
- 22 Servicing the HP XC System
- 22.1 Adding a Node
- 22.2 Replacing a Client Node
- 22.3 Actualizing Planned Nodes
- 22.4 Replacing a Server Blade Enclosure OnBoard Administrator
- 22.5 Replacing a System Interconnect Board in an HP CP6000 System
- 22.6 Software RAID Disk Replacement
- 22.7 Incorporating External Network Interface Cards
- 22.7.1 Gathering Information
- 22.7.2 Editing the platform_vars.ini File
- 22.7.3 Using the device_config Command
- 22.7.4 Updating the Database for the External Network Card
- 22.7.5 Updating the Firewall Custom Configuration
- 22.7.6 Reconfiguring the Nodes
- 22.7.7 Verifying Success
- 22.7.8 Updating the Golden Image
- A Installing LSF with SLURM into an Existing Standard LSF Cluster
- B Setting Up MPICH
- C HP MCS Monitoring
- D CPU Frequency-Based Power-Saving Feature
- Glossary
- Index

management interface include the hpasm package. You can use the /sbin/hplog utility to
display the following environment data:
• Thermal sensor data
• Fan data
• Power data
In addition, most hpasm errors are logged to the syslog system logger. For more information,
see hpasm(4) and hplog(8).
7.4 Monitoring Disks
The Self-Monitoring, Analysis and Reporting Technology (SMART) system is built into many
IDE, SCSI-3, and other hard drives. The purpose of SMART is to monitor the reliability of the
hard drive, to predict drive failures, and to carry out different types of hard drive self-tests.
Under HP XC, the smartd daemon monitors the SMART system on the CP6000 series. This
daemon writes all disk events to syslog. The Nagios check_syslogalerts plug-in is
configured to generate a Nagios alert for all smartd events in the consolidated log file.
NOTE: The smartd daemon only works on SCSI and IDE physical devices. It does not work
on drives attached to Smart Array cards or on logical drives in a hardware RAID configuration.
To modify the default configuration of the smartd daemon, you can use the /opt/hptc/
smartd/etc/smartd.conf template file. For more information on this file, see smartd.conf(5).
For more information on the smartd daemon, see smartd(8).
7.5 Displaying System Statistics
The HP XC System Software provides two methods for displaying system statistics: by issuing
commands from a host's command line or using the Nagios Web-based interface.
7.5.1 Displaying System Sensors from the Command Line
The shownode metrics sensors command displays the system sensors, their value, and a
brief description, with a date and time stamp. Sensor data includes the position of switches and
jumpers, temperature data, fan speeds, and so on.
The following example shows sensor data for node n14; some results are truncated horizontally
to fit on the page.
# shownode metrics sensors n14
Timestamp |Node_Id |Name |Value |Description
---------------------------------------------------------------------------
date and time stamp |n14 |Sensor count |29 |Sensors within threshold; ok
Individual sensors are displayed only when a sensor is out of range. Otherwise a sensor count
is displayed.
Invoking the command without specifying a node displays the sensor data for all the nodes in
the HP XC system as the following example shows. The output is truncated horizontally to fit
on the page.
# shownode metrics sensors
Timestamp |Node_Id |Name |Value |Description
---------------------------------------------------------------------------
date and time stamp |n15 |Sensor count |29 |Sensors within threshold; ok
date and time stamp |n14 |Sensor count |29 |Sensors within threshold; ok
date and time stamp |n13 |Sensor count |28 |Sensors within threshold; ok
date and time stamp |n12 |Sensor count |27 |Sensors within threshold; ok
7.5.2 Monitoring Processor Usage and Load from the Command Line
The shownode metrics cpus command displays the nice value (this value reflects the amount
of time the CPU has spent in user mode with low priority) as well as the user, system, and idle
88 Monitoring the System