
HP XC System Software Administration Guide Version 4.0
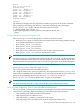
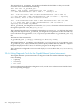
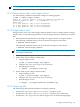
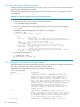
Table Of Contents
- XC Administration Guide
- Table of Contents
- About This Document
- 1 HP XC Administration Environment
- 1.1 Understanding Nodes, Services, and Roles
- 1.2 File System
- 1.3 HP XC Command Environment
- 1.4 Configuration and Management Database
- 1.5 HP XC Configuration File Guidelines
- 1.6 Installation and Software Distribution
- 1.7 Improved Availability
- 1.8 Networking
- 1.9 Modulefiles
- 1.10 Security
- 1.11 Recommended Administrative Tasks
- 2 Improved Availability
- 3 Starting Up and Shutting Down the HP XC System
- 4 Managing and Customizing System Services
- 4.1 HP XC System Services
- 4.2 Displaying Services Information
- 4.3 Restarting a Service
- 4.4 Stopping a Service
- 4.5 Global System Services
- 4.6 Customizing Services and Roles
- 4.6.1 Overview of the HP XC Services Configuration
- 4.6.2 Service Configuration Sequence of Operation
- 4.6.3 Assigning Roles with the cluster_config Utility
- 4.6.4 The *config.d Directories
- 4.6.5 Configuration Scripts
- 4.6.6 Understanding Global Configuration Scripts
- 4.6.7 Advance Planning
- 4.6.8 Editing the roles_services.ini File
- 4.6.9 Creating a service.ini File
- 4.6.10 Adding a New Service
- 4.6.11 Verifying a New Service
- 5 Managing Licenses
- 6 Managing the Configuration and Management Database
- 6.1 Accessing the Configuration and Management Database
- 6.2 Querying the Configuration and Management Database
- 6.3 Finding and Setting System Attribute Values
- 6.4 Backing Up the Configuration Database
- 6.5 Restoring the Configuration Database from a Backup File
- 6.6 Archiving Sensor Data from the Configuration Database
- 6.7 Restoring the Sensor Data from an Archive File
- 6.8 Purging Sensor Data from the Configuration and Management Database
- 6.9 Dumping the Configuration and Management Database
- 7 Monitoring the System
- 7.1 Monitoring Tools
- 7.2 Monitoring Strategy
- 7.3 Displaying System Environment Data
- 7.4 Monitoring Disks
- 7.5 Displaying System Statistics
- 7.6 Logging Node Events
- 7.7 The collectl Utility
- 7.8 Using HP Graph To Display Network Bandwidth and System Use
- 7.9 The resmon Utility
- 7.10 The kdump Mechanism and the crash Utility
- 8 Monitoring the System with Nagios
- 8.1 Nagios Overview
- 8.2 Using the Nagios Web Interface
- 8.3 Adjusting the Nagios Configuration
- 8.4 Configuring Nagios on HP XC Systems
- 8.5 Using the Nan Notification Aggregator and Delimiter To Control Nagios Messages
- 8.6 Nagios Report Generator Utility
- 8.7 Modifying Nagios To Effect Changes
- 9 Network Administration
- 10 Managing Patches and RPM Updates
- 11 Distributing Software Throughout the System
- 11.1 Overview of the Image Replication and Distribution Environment
- 11.2 Installing and Distributing Software Patches
- 11.3 Adding Software or Modifying Files on the Golden Client
- 11.4 Determining Which Nodes Will Be Imaged
- 11.5 Updating the Golden Image
- 11.6 Propagating the Golden Image to All Nodes
- 11.7 Maintaining a Global Service Configuration
- 12 Opening an IP Port in the Firewall
- 13 Connecting to a Remote Console
- 14 Managing Local User Accounts and Passwords
- 14.1 HP XC User and Group Accounts
- 14.2 General Procedures for Administering Local User Accounts
- 14.3 Adding a Local User Account
- 14.4 Modifying a Local User Account
- 14.5 Deleting a Local User Account
- 14.6 Configuring the ssh Keys for a User
- 14.7 Synchronizing the NIS Database
- 14.8 Changing Administrative Passwords
- 14.8.1 Changing the Superuser Password
- 14.8.2 Changing the CMDB Password
- 14.8.3 Changing the Interconnect Password
- 14.8.4 Changing the Console Port Password
- 14.8.5 Synchronizing the BMC/IPMI Password for CP6000 Systems
- 14.8.6 Changing the Nagios Administrator Password
- 14.8.7 Changing the LSF Administrator Password
- 15 Managing SLURM
- 16 Managing LSF
- 16.1 Standard LSF
- 16.2 LSF with SLURM
- 16.3 Switching the Type of LSF Installed
- 16.4 LSF with SLURM Installation
- 16.5 LSF with SLURM Startup and Shutdown
- 16.6 Controlling the LSF with SLURM Service
- 16.7 Launching Jobs with LSF with SLURM
- 16.8 Monitoring and Controlling LSF with SLURM Jobs
- 16.9 Maintaining Shell Prompts in LSF Interactive Shells
- 16.10 Job Accounting
- 16.11 LSF Daemon Log Maintenance
- 16.12 Load Indexes and Resource Information
- 16.13 LSF with SLURM Monitoring
- 16.14 LSF with SLURM Failover
- 16.15 Moving SLURM and LSF Daemons to Their Backup Nodes
- 16.16 Enhancing LSF with SLURM
- 16.17 Configuring an External Virtual Host Name for LSF with SLURM on HP XC Systems
- 17 Managing Modulefiles
- 18 Mounting File Systems
- 19 Managing Software RAID Arrays
- 20 Using Diagnostic Tools
- 20.1 Using the sys_check Utility
- 20.2 Using the ovp Utility for System Verification
- 20.3 Using the dgemm Utility to Analyze Performance
- 20.4 Using the System Interconnect Diagnostic Tools
- 21 Troubleshooting
- 21.1 General Troubleshooting
- 21.2 Nagios Troubleshooting
- 21.3 Messages Reported by Nagios
- 21.4 System Interconnect Troubleshooting
- 21.5 Improved Availability Issues
- 21.5.1 How To Start HP Serviceguard When Only the Head Node is Running
- 21.5.2 Restart Serviceguard Quorum Server if Quorum Server Node is Re-imaged
- 21.5.3 Known Limitation if Nagios is Configured for Improved Availability
- 21.5.4 Network Restart Command Negatively Affects Serviceguard
- 21.5.5 Problem Failing Over Database Package Under Serviceguard
- 21.6 SLURM Troubleshooting
- 21.7 LSF Troubleshooting
- 22 Servicing the HP XC System
- 22.1 Adding a Node
- 22.2 Replacing a Client Node
- 22.3 Actualizing Planned Nodes
- 22.4 Replacing a Server Blade Enclosure OnBoard Administrator
- 22.5 Replacing a System Interconnect Board in an HP CP6000 System
- 22.6 Software RAID Disk Replacement
- 22.7 Incorporating External Network Interface Cards
- 22.7.1 Gathering Information
- 22.7.2 Editing the platform_vars.ini File
- 22.7.3 Using the device_config Command
- 22.7.4 Updating the Database for the External Network Card
- 22.7.5 Updating the Firewall Custom Configuration
- 22.7.6 Reconfiguring the Nodes
- 22.7.7 Verifying Success
- 22.7.8 Updating the Golden Image
- A Installing LSF with SLURM into an Existing Standard LSF Cluster
- B Setting Up MPICH
- C HP MCS Monitoring
- D CPU Frequency-Based Power-Saving Feature
- Glossary
- Index

Killed
Test ran on: n1,n2,n3
Parsing output
level3: n1 - (NodeId = 4)
ERROR: Test incomplete
level3: n2 - (NodeId = 3)
ERROR: Test incomplete
level3: n3 - (NodeId = 2)
ERROR: Test incomplete
Parsing complete
Example 4
The following example parses the output files created from a previous run of this command.
This example specifies the log file directory created after unzipping and extracting the
qsnet2_drain_test log file, which is described in the next section.
# qsnet2_level_test level1 -d \
/var/log/diag/quadrics/qsnet2_drain_test/qsnet2_drain_test \
-parse
20.4.2.4 The qsnet2_drain_test Diagnostic Tool
This tool runs up to six tests for the Quadrics switches in an HP XC system:
• Runs the qsctrl utility to verify that the system interconnects are running within the proper
environmental parameters for operation.
• Runs qsnet2_level_test at level 1.
• Runs qsnet2_level_test at level 2.
• Runs qsnet2_level_test at level 3.
• Runs qsportmap on federated systems to test the link cable connectivity.
• Runs qsnet2_level_test at level 4 on federated systems.
Note:
You must launch this command from the head node. Run this command only during allocated
preventive maintenance time frames because this diagnostic tool uses the adapter and the link
100 percent of the time during the test and, as a result, has a great affect on machine performance.
The command format for qsnet2_drain_test utility is shown here:
qsnet2_drain_test [-help] [-d logdirectory]
The -help option displays the command line options.
The -d option enables you to specify a log directory. The output from the qsnet2_drain_test
utility and from individual tests is bundled in a tar file (compressed with the gzip utility) and
placed in the specified log directory; the directory/var/log/diag/quadrics/
qsnet2_drain_test is used by default if the -d option is not specified.
Note:
You must manually unzip the tar file, extract the files, and examine them for errors.
20.4.3 Using Diagnostic Tools for the InfiniBand Interconnect
The ib_prodmode_mon diagnostic tool monitors the Infiniband switches, looking for InfiniBand
network errors, generating alerts and notifying you if it detects these network errors:
• Links running at 1X speeds instead of the normal 4X
• Links reporting excessive Receive errors
• Links reporting IB_TIMEOUT, meaning the node is down.
• Links reporting a state other than PORT_ACTIVE, meaning the link is down.
20.4 Using the System Interconnect Diagnostic Tools 245