
HP XC System Software Administration Guide Version 4.0

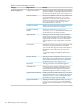
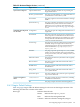
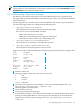
Table Of Contents
- XC Administration Guide
- Table of Contents
- About This Document
- 1 HP XC Administration Environment
- 1.1 Understanding Nodes, Services, and Roles
- 1.2 File System
- 1.3 HP XC Command Environment
- 1.4 Configuration and Management Database
- 1.5 HP XC Configuration File Guidelines
- 1.6 Installation and Software Distribution
- 1.7 Improved Availability
- 1.8 Networking
- 1.9 Modulefiles
- 1.10 Security
- 1.11 Recommended Administrative Tasks
- 2 Improved Availability
- 3 Starting Up and Shutting Down the HP XC System
- 4 Managing and Customizing System Services
- 4.1 HP XC System Services
- 4.2 Displaying Services Information
- 4.3 Restarting a Service
- 4.4 Stopping a Service
- 4.5 Global System Services
- 4.6 Customizing Services and Roles
- 4.6.1 Overview of the HP XC Services Configuration
- 4.6.2 Service Configuration Sequence of Operation
- 4.6.3 Assigning Roles with the cluster_config Utility
- 4.6.4 The *config.d Directories
- 4.6.5 Configuration Scripts
- 4.6.6 Understanding Global Configuration Scripts
- 4.6.7 Advance Planning
- 4.6.8 Editing the roles_services.ini File
- 4.6.9 Creating a service.ini File
- 4.6.10 Adding a New Service
- 4.6.11 Verifying a New Service
- 5 Managing Licenses
- 6 Managing the Configuration and Management Database
- 6.1 Accessing the Configuration and Management Database
- 6.2 Querying the Configuration and Management Database
- 6.3 Finding and Setting System Attribute Values
- 6.4 Backing Up the Configuration Database
- 6.5 Restoring the Configuration Database from a Backup File
- 6.6 Archiving Sensor Data from the Configuration Database
- 6.7 Restoring the Sensor Data from an Archive File
- 6.8 Purging Sensor Data from the Configuration and Management Database
- 6.9 Dumping the Configuration and Management Database
- 7 Monitoring the System
- 7.1 Monitoring Tools
- 7.2 Monitoring Strategy
- 7.3 Displaying System Environment Data
- 7.4 Monitoring Disks
- 7.5 Displaying System Statistics
- 7.6 Logging Node Events
- 7.7 The collectl Utility
- 7.8 Using HP Graph To Display Network Bandwidth and System Use
- 7.9 The resmon Utility
- 7.10 The kdump Mechanism and the crash Utility
- 8 Monitoring the System with Nagios
- 8.1 Nagios Overview
- 8.2 Using the Nagios Web Interface
- 8.3 Adjusting the Nagios Configuration
- 8.4 Configuring Nagios on HP XC Systems
- 8.5 Using the Nan Notification Aggregator and Delimiter To Control Nagios Messages
- 8.6 Nagios Report Generator Utility
- 8.7 Modifying Nagios To Effect Changes
- 9 Network Administration
- 10 Managing Patches and RPM Updates
- 11 Distributing Software Throughout the System
- 11.1 Overview of the Image Replication and Distribution Environment
- 11.2 Installing and Distributing Software Patches
- 11.3 Adding Software or Modifying Files on the Golden Client
- 11.4 Determining Which Nodes Will Be Imaged
- 11.5 Updating the Golden Image
- 11.6 Propagating the Golden Image to All Nodes
- 11.7 Maintaining a Global Service Configuration
- 12 Opening an IP Port in the Firewall
- 13 Connecting to a Remote Console
- 14 Managing Local User Accounts and Passwords
- 14.1 HP XC User and Group Accounts
- 14.2 General Procedures for Administering Local User Accounts
- 14.3 Adding a Local User Account
- 14.4 Modifying a Local User Account
- 14.5 Deleting a Local User Account
- 14.6 Configuring the ssh Keys for a User
- 14.7 Synchronizing the NIS Database
- 14.8 Changing Administrative Passwords
- 14.8.1 Changing the Superuser Password
- 14.8.2 Changing the CMDB Password
- 14.8.3 Changing the Interconnect Password
- 14.8.4 Changing the Console Port Password
- 14.8.5 Synchronizing the BMC/IPMI Password for CP6000 Systems
- 14.8.6 Changing the Nagios Administrator Password
- 14.8.7 Changing the LSF Administrator Password
- 15 Managing SLURM
- 16 Managing LSF
- 16.1 Standard LSF
- 16.2 LSF with SLURM
- 16.3 Switching the Type of LSF Installed
- 16.4 LSF with SLURM Installation
- 16.5 LSF with SLURM Startup and Shutdown
- 16.6 Controlling the LSF with SLURM Service
- 16.7 Launching Jobs with LSF with SLURM
- 16.8 Monitoring and Controlling LSF with SLURM Jobs
- 16.9 Maintaining Shell Prompts in LSF Interactive Shells
- 16.10 Job Accounting
- 16.11 LSF Daemon Log Maintenance
- 16.12 Load Indexes and Resource Information
- 16.13 LSF with SLURM Monitoring
- 16.14 LSF with SLURM Failover
- 16.15 Moving SLURM and LSF Daemons to Their Backup Nodes
- 16.16 Enhancing LSF with SLURM
- 16.17 Configuring an External Virtual Host Name for LSF with SLURM on HP XC Systems
- 17 Managing Modulefiles
- 18 Mounting File Systems
- 19 Managing Software RAID Arrays
- 20 Using Diagnostic Tools
- 20.1 Using the sys_check Utility
- 20.2 Using the ovp Utility for System Verification
- 20.3 Using the dgemm Utility to Analyze Performance
- 20.4 Using the System Interconnect Diagnostic Tools
- 21 Troubleshooting
- 21.1 General Troubleshooting
- 21.2 Nagios Troubleshooting
- 21.3 Messages Reported by Nagios
- 21.4 System Interconnect Troubleshooting
- 21.5 Improved Availability Issues
- 21.5.1 How To Start HP Serviceguard When Only the Head Node is Running
- 21.5.2 Restart Serviceguard Quorum Server if Quorum Server Node is Re-imaged
- 21.5.3 Known Limitation if Nagios is Configured for Improved Availability
- 21.5.4 Network Restart Command Negatively Affects Serviceguard
- 21.5.5 Problem Failing Over Database Package Under Serviceguard
- 21.6 SLURM Troubleshooting
- 21.7 LSF Troubleshooting
- 22 Servicing the HP XC System
- 22.1 Adding a Node
- 22.2 Replacing a Client Node
- 22.3 Actualizing Planned Nodes
- 22.4 Replacing a Server Blade Enclosure OnBoard Administrator
- 22.5 Replacing a System Interconnect Board in an HP CP6000 System
- 22.6 Software RAID Disk Replacement
- 22.7 Incorporating External Network Interface Cards
- 22.7.1 Gathering Information
- 22.7.2 Editing the platform_vars.ini File
- 22.7.3 Using the device_config Command
- 22.7.4 Updating the Database for the External Network Card
- 22.7.5 Updating the Firewall Custom Configuration
- 22.7.6 Reconfiguring the Nodes
- 22.7.7 Verifying Success
- 22.7.8 Updating the Golden Image
- A Installing LSF with SLURM into an Existing Standard LSF Cluster
- B Setting Up MPICH
- C HP MCS Monitoring
- D CPU Frequency-Based Power-Saving Feature
- Glossary
- Index
NOTE: These default settings may have been altered by site customizations. To display the
current values for your installation, use the Nagios Web interface: select View Config from the
Configuration section under the Nagios menu.
8.4.3 Understanding Nagios Alert Messages
The HP XC System Software provides several value-added plug-ins that can generate alert
messages based on patterns provided by various data sources, such as syslog and the Hardware
System Event logs.
All these plug-ins use a common syntax to describe patterns and status to report on matches.
The rules that trigger alarms are configured in the following files:
• /opt/hptc/nagios/etc/selRules
Contains patterns for alerting on System Event Log messages
The selRules file can be modified as follows:
— Add a rule to this file for a new alert.
— Modify the corresponding rule to change an existing alert.
— Comment out a rule to remove the corresponding rule.
• /opt/hptc/nagios/etc/syslogAlertRules
Contains patterns for alerting on consolidated log entries.
• /opt/hptc/nagios/ibexec/sensorData.dat
Contains patterns for alerting based on sensor results.
Nagios uses e-mail to send formatted alerts. The following is the default format of a Nagios alert:
Type: PROBLEM
1
State: return code
2
Service: service
3
Host: node
4
Address: IP Address
5
Info: message output
6
Date/Time: date and time stamp
7
Elapsed: time stamp
8
Number: number
9
1
Problem or Recovery
2
The Nagios plug-in return code; the values for this code:
0 OK
1 Warning
2 Critical
other
Unknown
3
The name of the Nagios service description, see the corresponding template file: /opt/
hptc/nagios/etc/templates/*_template.cfg.
4
The alert applies to this host name.
5
The IP address of the host.
6
The message output from the plug-in.
In the following example, [n47] indicates that this data was collected by the Nagios monitor
running on management hub n47. The message is from the plug-in associated with the
Nagios service for the system event log, in this case, /opt/hptc/nagios/libexec/
check_sel.
8.4 Configuring Nagios on HP XC Systems 125