
Platform LSF Administration Guide Version 6.2

Chapter 4
Working with Hosts
Administering Platform LSF
95
Viewing detailed server host information
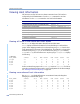
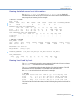
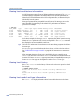
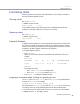
Run bhosts -l host_name and lshosts -l host_name to display all
information about each server host such as the CPU factor and the load thresholds to
start, suspend, and resume jobs. For example:
%
bhosts -l hostB
HOST hostB
STATUS CPUF JL/U MAX NJOBS RUN SSUSP USUSP RSV DISPATCH_WINDOWS
ok 20.20 - - 0 0 0 0 0 -
CURRENT LOAD USED FOR SCHEDULING:
r15s r1m r15m ut pg io ls it tmp swp mem
Total 0.1 0.1 0.1 9% 0.7 24 17 0 394M 396M 12M
Reserved 0.0 0.0 0.0 0% 0.0 0 0 0 0M 0M 0M
LOAD THRESHOLD USED FOR SCHEDULING:
r15s r1m r15m ut pg io ls it tmp swp mem
loadSched - - - - - - - - - - -
loadStop - - - - - - - - - - -
%
lshosts -l hostB
HOST_NAME: hostB
type model cpuf ncpus ndisks maxmem maxswp maxtmp rexpri server
Sun4 Ultra2 20.2 2 1 256M 710M 466M 0 Yes
RESOURCES: Not defined
RUN_WINDOWS: (always open)
LICENSES_ENABLED: (LSF_Base LSF_Manager LSF_MultiCluster LSF_Make)
LOAD_THRESHOLDS:
r15s r1m r15m ut pg io ls it tmp swp mem
-1.0 ------ - -4M
Viewing host load by host
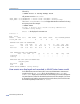
The lsload command reports the current status and load levels of hosts in a cluster.
The
lshosts -l command shows the load thresholds.
The
lsmon command provides a dynamic display of the load information. The LSF
administrator can find unavailable or overloaded hosts with these tools.
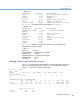
Run
lsload to see load levels for each host. For example:
%
lsload
HOST_NAME status r15s r1m r15m ut pg ls it tmp swp mem
hostD ok 1.3 1.2 0.9 92% 0.0 2 20 5M 148M 88M
hostB -ok 0.1 0.3 0.7 0% 0.0 1 67 45M 25M 34M
hostA busy 8.0 *7.0 4.9 84% 4.6 6 17 1M 81M 27M
The first line lists the load index names, and each following line gives the load levels for
one host.