
HP XC System Software Installation Guide Version 3.2

6. When all OVP tests pass, proceed to “Task 4: Run the SVA OVP Utility” (if SVA is installed)
or “Task 5: View System Health”.
4.4 Task 4: Run the SVA OVP Utility
Run the SVA OVP utility only if you installed and configured SVA. The SVA OVP runs a series
of Chromium demonstration applications on all defined display surfaces, which verifies the
successful installation of SVA.
Follow this procedure to start the SVA OVP:
1. If the X server is used on the head node for the DMX console window, enable connections
from any host:
# xhost+
2. Start the SVA OVP utility:
# sva_ovp
For more information about the options for the SVA OVP utility, see the SVA System Administration
Guide.
When all SVA OVP tests pass, proceed to “Task 5: View System Health”.
4.5 Task 5: View System Health
HP recommends that you use the following tools to view system health:
• “Nagios Web Interface” (page 115)
• “The nrg Command” (page 115)
4.5.1 Nagios Web Interface
Nagios is the system and network health monitoring application on an HP XC system. It watches
hosts and services and alerts you when problems occur or are resolved. HP recommends that
you start up the Nagios web interface now to view the network and ensure that all hosts and
services are in the green state.
Use this procedure to open the Nagios web page:
1. Open a browser on the head node.
2. Enter the following web address in the Address field:
https://fully_qualified_HP_XC_hostname/nagios
3. When prompted, log in as the nagiosadmin user and specify the Nagios administrator
password.
If the hardware configuration contains less than 100 nodes, the Service Detail view provides
a good overview of the system. It lists the Nagios hosts and shows their status.
The Service Problems view is more useful for hardware configurations with hundreds or
thousands of nodes. It provides a practical overview of the system.
See the HP XC System Software Administration Guide if you need more information about how to
use Nagios.
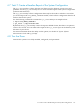
4.5.2 The nrg Command
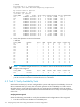
The nrg command uses data collected by the Nagios utility to generate reports. Use the summary
option to display a summary of defined Nagios services and the state of those services.
# nrg --mode summary
Apache HTTPS Server 1-Ok 0-Warn 0-Crit 0-Pend 0-Unk
configuration 10-Ok 0-Warn 0-Crit 0-Pend 0-Unk
Configuration Monitor 1-Ok 0-Warn 0-Crit 0-Pend 0-Unk
Environment 10-Ok 0-Warn 0-Crit 0-Pend 0-Unk
4.4 Task 4: Run the SVA OVP Utility 115