
HP XC System Software Administration Guide Version 3.1
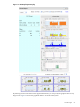


The Metric menu influences the display of the detail graphs for a system display. This menu offers the
following choices:
bytes in This graph reports the rate of data received on all network devices on the node.
bytes out This graph reports the rate of data transmitted on all network devices on the node.
cpu idle This graph indicates how much of the node's CPU set was available for other tasks.
cpu iowait This graph reports the percent of time the system was waiting for I/O to complete or
to handle an interrupt.
cpu system This graph shows how much of the CPU time has been spent on system-level tasks.
cpu usage This graph reports how much of the node's CPU set was spent in the user, system,
and nice states.
This is the default.
load average This graph reports the 1, 5, and 15 minute load averages.
mem buffers This graph shows how much of the node's memory was allocated to system-wide
memory buffers.
mem shared This graph reports the amount of memory being shared among applications.
mem used This graph reports the percent of memory in use for all activities, for example, code,
buffers, and shared memory.
swap info This graph reports the amount of swap space available and the amount of swap space
in use.
The Last menu specifies the length of the sample data. The choices are:
• 2 days
• 1 week
• 2 weeks
• 1 month
• 1 year
• 1 hour
• 2 hours
• 6 hours
• 12 hours
• 1 day
You can specify how the utility sorts the detail graphs with the Sorted menu. The options are:
ascending Displays those nodes whose data is greatest first.
by hostname Displays the nodes in order by hostname regardless of the data.
descending Displays those nodes whose data is least first.
The System Details link opens the Nagios Ser vice Status Details for All Hosts window.
Selecting the Get Fresh Data button in the top right-hand corner updates the graph with any available
new data.
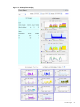
The Job Manager portion of the display provides applicable information on LSF and SLURM.
For LSF, the LSF host names are listed with their status, their maximum memory allocation, and the number
of jobs running. This information is summarized from the lshosts and bhosts commands.
For SLURM, the Job Manager lists the name of each SLURM partition, its state, and the number of nodes
allocated.
7.9 The netdump and crash Utilities
The netdump utility is a tool developed by Red Hat that sends a kernel dump (oops data and memory
dumps) from a monitored client system to another system in the network. That system, which runs a utility
named netdump-server, stores the kernel dumps. The default location for these kernel dumps is in the
/var/crash directory.
The crash utility is a self-contained tool that you can use to investigate live systems or to examine kernel
core dumps created with the netdump package.
96 Monitoring the System