
HP XC System Software Administration Guide Version 3.1


7.8 HP Graph
The RRDtool software tool is integrated into the HP XC system to create and displays graphs about the
network bandwidth and other system utilization.
You can access this display by selecting HP Graph in the Nagios menu.
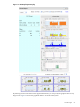
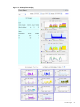
Figure 7-4 is an example of the default display. It provides an overview of the system with graphs for node
allocation, CPU usage, memory, Ethernet traffic, and, if relevant, Interconnect traffic. It also provides
smaller “detail” graphs for the CPU usage of each of the nodes on the HP XC system.
92 Monitoring the System