
HP XC System Software Administration Guide Version 3.1

---------------------------------------------------------------------------
date and time stamp |n14 |Sensor count |29 |Sensors within threshold; ok
Individual sensors are displayed only when a sensor is out of range. Otherwise a sensor count is displayed.
Invoking the command without specifying a node displays the sensor data for all the nodes in the HP XC
system as the following example shows. The output is truncated horizontally to fit on the page.
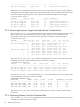
# shownode metrics sensors
Timestamp |Node_Id |Name |Value |Description
---------------------------------------------------------------------------
date and time stamp |n15 |Sensor count |29 |Sensors within threshold; ok
date and time stamp |n14 |Sensor count |29 |Sensors within threshold; ok
date and time stamp |n13 |Sensor count |28 |Sensors within threshold; ok
date and time stamp |n12 |Sensor count |27 |Sensors within threshold; ok
7.5.2 Monitoring Processor Usage and Load from the Command Line
The shownode metrics cpus command displays the nice value (this value reflects the amount of time
the CPU has spent in user mode with low priority) as well as the user, system, and idle times (in
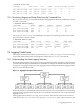
milliseconds) for each processor on the node from which this command is issued. For example:
# shownode metrics cpus
Timestamp |Node |CPU# |User |Nice |System |Idle |I/O |IRQ |Soft_IRQ
------------------------------------------------------------------------------------------
date and time stamp |n15 |0 |22200 |222600 |69000 |12061800 |163920 |240 |3180
| |1 |11940 |223200 |35400 |12251280 |7560 |0 |0
| |2 |8220 |223680 |231600 |11625480 |102840 |48840 |288840
| |3 |25440 |200820 |69960 |12176580 |56040 |120 |540
date and time stamp |n16 |0 |21000 |253740 |55020 |9567900 |561960 |180 |5460
| |1 |9780 |266160 |127320 |9806220 |241200 |0 |900
| |2 |11280 |228600 |258060 |9354660 |246000 |52440 |300540
| |3 |25440 |203640 |72480 |9978540 |166020 |120 |540
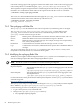
The shownode metrics cputotals command also displays the nice value as well as the user, system,
and idle times (in milliseconds), and for the node as a whole. For example:
# shownode metrics cputotals
Timestamp |Node |User |Nice |System |Idle |I/O |IRQ |Soft_IRQ
-----------------------------------------------------------------------------------------
date and time stamp |n14 |67860 |870360 |406080 |48115200 |330480 |49320 |292680
date and time stamp |n15 |67560 |952200 |513060 |38707440 |1215240 |52860 |307500
date and time stamp |n16 |2586660 |1460520 |2476500 |124200600 |2032260 |42180 |698520
The shownode metrics load command displays 1-, 5-, and 15-minute processor load averages for the
node on which this command is issued. For example:
# shownode metrics load
Timestamp |Node |1 min |5 min |15 min |# Running |# threads
---------------------------------------------------------------------------
date and time stamp |n14 |0.00 |0.00 |0.04 |1 |73
date and time stamp |n15 |0.00 |0.00 |0.08 |1 |71
date and time stamp |n16 |0.00 |0.10 |0.28 |1 |216
The columns for ar0, ar1, and ar2 indicate the load average for 1 minute, 5 minutes, and 15 minutes,
respectively.
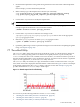
7.5.3 Monitoring Memory from the Command Line
The shownode metrics mem command displays memory total and usage information for the node on
which this command is issued. For example:
86 Monitoring the System