
HP XC System Software Administration Guide Version 3.1

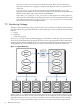

database. The Root Supermon also connects to all other Supermon services and manages a subset of
nodes. The syslog daemons report events to the syslog-ng services
Other tools, such as collectl, work independently from this structure.
7.3 Displaying System Environment Data
The HP XC System Software uses the Nagios monitoring application to gather and display environment
data. The HP XC System Software provides plug-ins that monitor each node's environment data, such as
temperature and fan speed, which can be indicators of possible node failure.
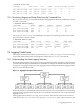
To display environment data, first select the Service Problems menu item in the left frame of the Nagios
main window, shown in Figure 8-2 (page 104), to open the Service Status for All Hosts window.
For additional information about the Nagios Service Status for All Hosts window and related topics, select
Documentation on the Nagios menu, or visit the Nagios Web site:
http://www.nagios.org
You can also use the shownode metrics sensors command to display environmental data. See
“Displaying System Sensors from the Command Line” (page 85) for more information.
Depending on the platform, there may be tools that allow you to collect information specific to the platform.
Typically, this same information is collected and available in the HP XC database from the shownode
metrics sensors command. For example, systems that support the iLO management interface include
the hpasm package. You can use the /sbin/hplog utility to display the following environment data:
• Thermal sensor data
• Fan data
• Power data
In addition, most hpasm errors are logged to the syslog system logger. For more information, see hpasm(4)
and hplog(8).
7.4 Monitoring Disks
The Self-Monitoring, Analysis and Reporting Technology (SMART) system is built into many IDE, SCSI-3,
and other hard drives. The purpose of SMART is to monitor the reliability of the hard drive, to predict
drive failures, and to carry out different types of hard drive self-tests.
Under HP XC, the smartd daemon monitors the SMART system on the CP6000 series. This daemon writes
all disk events to syslog. The Nagios check_syslogalerts plug-in is configured to generate a Nagios
alert for all smartd events in the consolidated log file.
NOTE: The smartd daemon only works on SCSI and IDE physical devices. It does not work on drives
attached to Smart Array cards or on logical drives in a hardware RAID configuration.
To modify the default configuration of the smartd daemon, you can use the
/opt/hptc/smartd/etc/smartd.conf template file. For more information on this file, see smartd.conf(5).
For more information on the smartd daemon, see smartd(8).
7.5 Displaying System Statistics
The HP XC System Software provides two methods for displaying system statistics: by issuing commands
from a host's command line or using the Nagios Web-based interface.
7.5.1 Displaying System Sensors from the Command Line
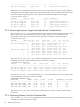
The shownode metrics sensors command displays the system sensors, their value, and a brief
description, with a date and time stamp. Sensor data includes the position of switches and jumpers,
temperature data, fan speeds, and so on.
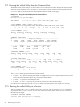
The following example shows sensor data for node n14; some results are truncated horizontally to fit on
the page.
# shownode metrics sensors n14
Timestamp |Node_Id |Name |Value |Description
7.3 Displaying System Environment Data 85