
HP XC System Software Administration Guide Version 3.1
The HP XC system event log functionality provides complete management of all log types of supported
HP platforms. Log information is regularly read, archived, and used to generate Nagios alerts when
applicable. Logs that approach a critical size are cleared to prevent loss of event data.
Event logs are typically accessed through the management port. They require platform- and protocol-specific
user authentication as well as network access to the console port (cp-nxxx, where nxxx is the node
number). System event log history is captured in /hptc_cluster/adm/logs/sel/sel-nxxx.log,
where nxxx represents the name of the individual node. Logs are managed by the standard logrotate
functionality. For more information on this facility, see logrotate(8).
8.4.4.2 System Event Log Configuration
The system event log and hardware sensor information is gathered for HP XC systems. Some platforms
require additional user name and password setup to allow access to the connection on the console port.
In addition, depending on how the head node console connection is attached to the network, additional
setup may be required.
8.4.4.3 Additional Optional Configuration
You can change the rotation of the system event logs and the rules for Nagios alerts.
You can reconfigure the rotation of the node event logs with the logrotate command.
Nagios creates alerts for power, memory, voltage, and ASR (Automatic System Recovery) messages. The
rules for alerts are defined in the /opt/hptc/nagios/etc/selRules file. You can modify these rules
by editing this file as follows:
• Add rules to this file for new alerts.
• Change alerts by modifying the corresponding rule in this file.
• Remove a rule to delete the corresponding alert.
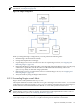
8.5 Nan Notification Aggregator and Delimiter
The HP XC System Software incorporates the Nan notification aggregator and delimiter for the Nagios
paging system. Nan is an open source supplement to the Nagios application.
Nagios is capable of sending quantities of messages especially when the system is starting up, shutting
down, or experiencing a failure. The Nan front-end utility overcomes the problem of multiple messages
by collecting, batching, and reformatting these messages so that they are sent in a controlled manner. You
can configure how multiple concatenated notifications are sorted so that the most important notifications
appear at the top.
The Nan utility consists of the following:
• A daemon, nand
This daemon is started on the Nagios master node.
• A client, nanc
The nanc client is configured as the Nagios e-mail command.
• The nand daemon /opt/hptc/nagios/etc/nand.conf configuration file.
• The nanc client /opt/hptc/nagios/etc/nanc.conf configuration file.
When the nand daemon receives a notification from Nagios, it starts a timer. If the notification is a PROBLEM
or RECOVERY, the default time is 300 seconds; if the notification is an ACKNOWLEDGEMENT, the default
time is 600 seconds. Subsequent Nagios notifications are queued in the
/opt/hptc/nagios/var/nanqueue directory until the specified time elapses. Then the nand daemon
sends a condensed message based on the following criteria:
• The delivery method: pager, e-mail, and so on
If the delivery method is a pager, the number of messages influences the format of the condensed
message.
• The corresponding destination address: the pager telephone number or the e-mail address
• The notification type: PROBLEM, ACKNOWLEDGEMENT, or RECOVERY
120 Monitoring the System with Nagios