
HP XC System Software Administration Guide Version 3.1
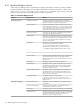
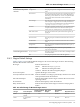
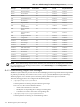

Table 8-2 Monitored Nagios Services (continued)
FunctionNagios ServiceCategory
This plug-in reports the configuration information for a single
node.
ConfigurationIndividual Status Reported for
All Nodes
This plug-in provides per-node sensor reporting and alerts. It
reports on an individual node's sensor status. Depending on
the node type, all available “live” sensors are reported. Select
the link in the Status Information column for detailed
information.
Environment
This plug-in provides per-node load average information and
alerts. It reports a single node's most recently collected load
average. Alerts are generated based on thresholds defined in
/opt/hptc/nagios/etc/nagios_vars.ini.
Load Average
This plug-in provides per-node process, user, and disk statistics.
It reports and alerts based on an individual node's process
counts, total, user, zombie processes, and system uptime.
NodeInfo
This plug-in monitors the system interconnect regularly by
pinging it.
PING Interconnect
This plug-in reports and alerts based on this node's resource
usage.
Resource Status
This plug-in reports and alerts based on this node's SLURM
status.
SLURM Status
This plug-in reports and alerts based on this node's syslog
alert matches.
Syslog Alerts
This plug-in displays the system free space reported by
Supermon for this node.
System Free Space
This plug-in reports ProCurve switch status, including available
sensor information.
cluster necs1-1
Switch and Appliance Status
This plug-in reports the status of the SFS appliance.SFS
8.4.2 Nagios Default Settings
Table 8-3 (page 117) provides the default settings for the services that Nagios monitors. The following
describes the columns in this table:
Host Type Indicates the node role:
Master
Indicates the nagios_master
Hub Indicates the management hub
Common Indicates all nodes managed by Nagios
Service Description Specifies the Nagios service name.
Actively launched on service node? Indicates whether or not Nagios periodically runs this service check
at the specified normal check interval.
Max Check Attempts Indicates the number of times Nagios examines the service before
reporting a failure.
Normal check Indicates the frequency of the check interval.
Retry check interval Indicates the amount of time Nagios waits before retrying after a
failure.
Table 8-3 Default Settings for Monitored Nagios Services
Retry Check Interval
Normal Check
Interval
Max. Check
Attempts
Actively Launched on
Service Node?Service DescriptionHost Type
0h 2m 0s60h 0m 0s3YesConfiguration
Monitor
Master
0h 1m 0s0h 5m 0s3YesIP Assignment -
DHCP
Master
8.4 Configuring Nagios on HP XC Systems 117