
HP XC System Software Administration Guide Version 3.1

8.4.1 Monitored Nagios Services
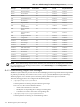
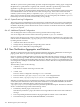
Table 8-2 lists each Nagios service, also known as a plug-in, that Nagios monitors, by category and the
function. The items in the Nagios Service column of this table correspond to the Service column of the
Nagios Service Detail View and Service Problems View windows. Figure 8-4 (page 106) and
Figure 8-6 (page 108) show an example of these windows, respectively.
Table 8-2 Monitored Nagios Services
FunctionNagios ServiceCategory
This plug-in updates node configuration. It periodically
generates and updates configuration display information for
all nodes in the HP XC system (see Configuration).
Configuration MonitorMonitoring Plug-Ins
Enclosures for HP Blade systems are represented as hosts in
nagios web interface. The check_enclosures plug-in alerts
you if sensor data for the enclosures is outside its operational
range. Updates to the /opt/hptc/supermon/bin/sensors
script collect environmental data for enclosures.
Enclosure Monitor
This plug-in watches the LSF master daemon and reports its
status. It causes LSF failover if required.
LSF Failover Monitor
This plug-in watches the Nagios master and Nagios monitor
nodes. It reports on the status of the Nagios master and monitor
daemons across the HP XC system. Nagios daemons run only
on service nodes. Smaller systems might have only a single
master on the head node.
Nagios Monitor
This plug-in examines node status asynchronously and stores
the results (using attributes) in the CMDB.
You can invoke this plug-in from the command line to
determine the node status (that is, up or down) as follows:
# /opt/hptc/nagios/libexec/check_node -list
Host Monitor
This plug-in collects and gathers resource (squeue) information
for this monitor/masters set of managed nodes (domain).
Individual node status is displayed through the Resource Status
Nagios service.
Resource Monitor
This plug-in monitors an attached SFS appliance.SFS Monitor
This plug-in collects, gathers, and reports resource (sinfo)
information for this monitor/masters set of managed nodes
(domain). Individual node status is displayed through the
SLURM Status Nagios service.
SLURM Monitor
This plug-in gathers (predetermined) supermon metrics for
this monitor/masters set of managed nodes (domain). This
plug-in collects loadave, environmental, node information
data and stored to the CMDB.
Supermon Metrics Monitor
This plug-in watches for patterns in the
/opt/hptc/nagios/etc/syslogAlertRules file.
Individual per-node results are reported by the Syslog Alerts
Nagios service.
Syslog Alert Monitor
This plug-in monitors the Web server providing the Nagios
Web interface.
Apache HTTPS ServerSystem Service Reports
This plug-in verifies that the ssh configuration files are
synchronized across the HP XC system.
Root key synchronization
This plug-in gathers switch status and metrics through SNMP.Switch status
This plug-in monitors the hardware event log for iLO and IPMI
based systems and issues alerts based on patterns in selRules
file. For more information, see the “System Event Log
Monitoring” (page 119) Nagios service.
System Event Log
116 Monitoring the System with Nagios