
HP XC System Software Administration Guide Version 3.1

# 'nagios' contact definition
define contact{
contact_name nagios
alias Nagios Admin
service_notification_period 24x7
host_notification_period 24x7
service_notification_options w,u,c,r
host_notification_options d,u,r
service_notification_commands notify-by-email,notify-by-epager
host_notification_commands host-notify-by-email,host-notify-by-epager
email nagios@localhost.localdomain
pager nagios@localhost.localdomain
}
Changing the values for email and pager to reflect your system's name enables Nagios to send notification
through the sendmail utility. For example, changing nagios@localhost.localdomain to
nagios@example.com.
NOTE: Nagios can generate many e-mail messages. You can use the open source Nan utility to help
control these messages. For more information, see “Nan Notification Aggregator and Delimiter” (page 120).
8.3.4 Changing Sensor Thresholds
Job loads, usage patterns, process types, counts, memory, cache, disk subsystems, and so on all contribute
input to Nagios. Nagios uses threshold values to determine whether or not to send an alert, and, if so,
whether that alert is critical or a warning. Nagios monitors the sensor thresholds and generates alerts
when a threshold is reached. Depending on your specific site configuration and use, some default thresholds
might not be appropriate for your system.
The platform-dependent default thresholds provided in the HP XC system serve as a baseline, but they
might not be optimal for your site. As system administrator, you need to determine the threshold values
appropriate for your site and customize the Nagios configuration.
The /opt/hptc/nagios/etc/nagios_vars.ini file represents various constants and variables used
throughout the HP XC system's plug-ins and the Nagios configurations. You can edit this file to customize
Nagios for the thresholds. Changing these values changes when Nagios alerts you to subsystems
encountering thresholds.
The nagios_vars.ini file also contains variables that are commented out. Examine the content of the
file to determine if those variables are appropriate for your system. If so, remove the comment characters
accordingly. This portion of the nagios_vars.ini file is an example:
# Note any sensors matched by the following patterns will
# be individually archived and viewable via shownode metrics sensors
# any sensors not matched will be reported as a single group
# status when it is within threshold. Any sensor reporting
# outside of its thresholds will always be individually archived.
# SENSORPRINT0 = CPU[0-9]+ TEMP
# SENSORPRINT1 = SYS TEMP
If you change the nagios_vars.ini file, be sure to propagate the file to the appropriate nodes, usually
the management hubs, on your system; see Chapter 10 (page 129) for more information. “Updating the
Nagios Configuration” (page 110) describes the overall procedure for updating the Nagios configuration.
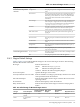
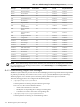
8.3.5 Adjusting the Time Allotted for Metrics Collection
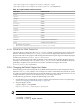
Table 8-1 displays the default collection intervals for the Supermon Metrics Monitor service.
The Supermon Metrics Monitor schedules and collects individual metrics at a specified interval. You can
change an interval. The interval must be a multiple of the time specified by the value of the
normal_check_interval parameter defined in the
112 Monitoring the System with Nagios