
HP XC System Software Administration Guide Version 3.1

The term Hosts on the Nagios window refers to any entity with an IP address, not just nodes.
For example, Nagios monitors the 1,024 nodes and four switches in an HP XC system, and reports on the
status of 1,028 hosts. SFS is also an example of a Nagios host; Nagios finds the name of the SFS server and
displays its status.
Keep this in mind when using the Nagios application.
The HP XC System Software provides plug-ins that monitor these and other system statistics.
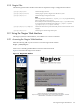
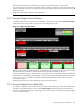
8.2.2 Using the Nagios Tactical Overview
The Nagios Tactical Overview provides an overall view of the HP XC system. Select Tactical Overview
in the Nagios menu to open this view. Figure 8-3 is an example of this view.
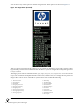
Figure 8-3 Nagios Tactical Overview
The top of the window provides information on the network. It provides the number of network outages
and information on the network health in terms of the Nagios hosts and Nagios services.
The next portion of the window has information on the Nagios hosts. It reports the number of hosts down,
unreachable, up, and pending. In the example, one host is down. Selecting the link in that box opens the
Host Status Details window for that host, which identifies the hosts and provides some status
information for them.
Similarly, Nagios services are described in the next portion of the window.
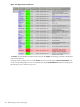
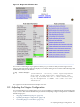
8.2.3 Using the Nagios Service Detail View
For systems comprised of tens of nodes, the Service Detail view provides a good view of the Nagios hosts
and their corresponding Nagios services. Select Service Detail in the Nagios menu to open this view.
Figure 8-4 is an example of a portion of the Nagios Service Detail view. It is truncated, showing the Nagios
services for the head node.
8.2 Using the Nagios Web Interface 105