
HP XC System Software Administration Guide Version 3.1

8 Monitoring the System with Nagios
The Nagios open source application has been customized and configured to monitor the HP XC system
and network health. This chapter introduces Nagios and discusses these modifications. This chapter
addresses the following topics:
• “Nagios Overview” (page 101)
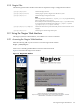
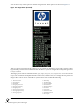
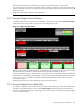
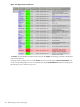
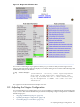
• “Using the Nagios Web Interface” (page 103)
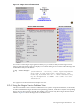
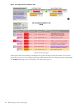
• “Adjusting the Nagios Configuration” (page 109)
• “Configuring Nagios on HP XC Systems” (page 115)
• “Nan Notification Aggregator and Delimiter” (page 120)
• “Nagios Report Generator Utility” (page 121)
For information on using Nagios to monitor the optional HP Modular Cooling System (MCS), see
Appendix D (page 273).
8.1 Nagios Overview
The HP XC System Software uses the Nagios open source application to gather and display system statistics,
such as processor load and disk usage. Nagios watches hosts and services and alerts you when problems
occur or are resolved. HP XC System Software integrates Nagios with software packaged with the HP XC
System Software including Supermon, SLURM, and LSF.
The design of the Nagios application incorporates the concept of a plug-in, that is, an independent file
that extends the Nagios application. This design allows the development of service checks, which are use
to examine system and network services.
Nagios, as provided with the HP XC System Software, is configured with system and network service
checks already in place for your system; they were automatically configured for each node with the nagios
nconfig script when the cluster_config utility was run.
The HP XC system automatically configures the Nagios environment based on the configuration of the
HP XC system. Autoconfiguration is based on the information in the HP XC configuration and management
database (CMDB). The configuration is updated as a result of changes to the HP XC database.
Nagios obtains most of its data from the Supermon open source monitoring application, which is integrated
with the HP XC System Software.
The Nagios master can be configured for improved availability. When configured for improved availability,
the head node must have the management_server role but not the management_hub role; the other
node in the availability set must have the management_server role and the management_hub role. By
default, the head node acts as the Nagios master and the other node in the availability set acts as a
Nagios_monitor. If the head node fails, the availability tool reconfigures the other node in the availability
set to act as both the Nagios master and a Nagios monitor.
You can find the complete documentation for Nagios on the Nagios Web site:
www.nagios.org
Specific information on Nagios features are available on the following Web site:
www.nagios.org/about/
Additional information on Nagios is commercially available. The following Web site lists documents that
describe Nagios and its use for system and network administration:
http://www.nagios.org/propaganda/books/
“Messages Reported by Nagios” (page 232) describes troubleshooting information reported by Nagios.
This section addresses the following topics:
• “Nagios Components” (page 102)
• “Nagios Hosts” (page 102)
• “Nagios Plug-Ins” (page 102)
• “Nagios Web Interface” (page 102)
• “Nagios Files” (page 103)
8.1 Nagios Overview 101