
HP XC System Software Administration Guide Version 3.0


For additional information about the Nagios Service Status for All Hosts window and related topics, select
Documentation on the Nagios menu, or visit the Nagios Web site:
http://www.nagios.org .
You can also use the shownode metrics sensors command to display environmental data. See
“Displaying System Sensors from the Command Line” (page 72) for more information.
Depending on the platform, there may be tools that allow you to collect information specific to the platform.
Typically, this same information is collected and available in the HP XC database from the shownode
metrics sensors command. For example, systems that support the iLO management interface include
the hpasm package. You can use the /sbin/hplog utility to display the following environment data:
• Thermal sensor data
• Fan data
• Power data
In addition, most hpasm errors are logged to the syslog system logger. For more information, see hpasm(4)
and hplog(8).
Displaying System Statistics
The HP XC System Software provides two methods for displaying system statistics: by issuing commands
from a host's command line or using the Nagios Web-based interface.
Displaying System Sensors from the Command Line
The shownode metrics sensors command displays the system sensors, their value, and a brief
description, with a date and time stamp. Sensor data includes the position of switches and jumpers,
temperature data, fan speeds, and so on.
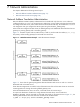
The following example shows sensor data for node n9; some results are truncated horizontally to fit on the
page.
# shownode metrics sensors n9
Timestamp |Node_Id |Name |Value |Description
-----------------------------------------------------------------------
date time |n9 |12V Pwr Supply 1 |0 |indeterminate
date time |n9 |12V Pwr Supply 2 |0 |indeterminate
date time |n9 |12V Rail 0 |0 |indeterminate
date time |n9 |12V Rail 1 |0 |indeterminate
date time |n9 |12V Rail 2 |0 |indeterminate
date time |n9 |12V Rail 3 |0 |indeterminate
date time |n9 |12V Rail 4 |0 |indeterminate
date time |n9 |Ambient Temp |20 |deg C<= lower non-criti...
date time |n9 |Battery Voltage |0 |performance met
date time |n9 |Fan 1A Tach |5760 |rpm<= lower non-critica...
date time |n9 |Fan 1B Tach |5940 |rpm<= lower non-critica...
date time |n9 |Fan 2B Tach |4290 |rpm<= lower non-critica...
date time |n9 |Fan 2F Tach |4050 |rpm<= lower non-critica...
date time |n9 |Fan 3B Tach |2430 |rpm<= lower non-critica...
date time |n9 |Fan 3F Tach |2640 |rpm<= lower non-critica...
date time |n9 |Fan CPU0 Tach |4080 |rpm<= lower non-critica...
date time |n9 |Fan CPU1 Tach |3990 |rpm<= lower non-critica...
date time |n9 |Processor 0 Temp |53 |deg C<= lower non-criti...
date time |n9 |Processor 1 Temp |53 |deg C<= lower non-criti...
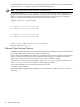
Individual sensors are displayed only when a sensor is out of range. Otherwise a sensor count is displayed
as shown in the following example. The output is truncated horizontally to fit on the page.
# shownode metrics sensors
Timestamp |Node_Id |Name |Value |Description
-----------------------------------------------------------------------
72 Monitoring the System