
HP XC System Software Administration Guide Version 3.0


The syslogng_forward service on each regional node enables the node to act as a log aggregator for
the global node. Log information is gathered, consolidated, and forwarded to the global node; the global
node is not necessarily the head node.
Nagios has a syslog plug-in , check_syslogAlerts, that applies a set of rules against all the events
in the consolidated log file and generates alerts for those events that match one of the rules. The rules reside
in the /opt/hptc/nagios/etc/syslogAlertRules. You can modify this rules file if you want to add
additional rules.
The collectl Utility
You can use the collectl utility to collect data on the nodes of the HP XC system. As a development or
debug tool, the collectl utility typically gathers more detail more frequently than the supermon utility.
The collectl utility does have some overhead, but for most situations, it consumes less than 0.1 percent
of the CPU and has minimal effect on user applications. However, even this low level can have a significant
impact on some applications, so use the collectl utility with care.
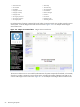
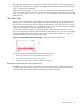
The collectl utility also enables you to play back the data in either raw ASCII characters or in a plot
form, which can be used to display the data with GnuPlot or Microsoft Excel. Figure 6-6. shows one example
of the plotted graph based on the collectl utility's collection of CPU data. Example 6-1. (page 70)
provides an illustration of collectl utility's ASCII output.
Figure 6-6. Plotted Output from the collectl Utility Plotted Output from the collectl Utility
You can use any of the following methods to run the collectl utility:
• Running the collectl Utility from the Command Line (page 69)
• Running the collectl Utility as a Service (page 70)
• Running the collectl Utility in a Batch Job Submission (page 71)
Running the collectl Utility from the Command Line
The default action of this utility is to collect data at 10-second intervals and to display the data in ASCII
characters on the terminal screen. Example 6-1. shows the invocation and first record reported from the
collectl utility. The information has been edited to fit horizontally on the page.
Monitoring Tools 69