
HP XC System Software Administration Guide Version 3.0
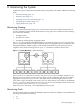
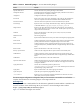
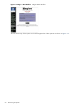

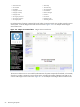
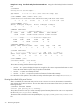

Table 6-1. Services Monitored by Nagios Services Monitored by Nagios
FunctionService
Monitors the Web server providing the Nagios Web interfaceApache HTTPS Server
Periodically generates and updates configuration display information for all nodes in
the HP XC system (see “configuration” below)
Configuration Monitor
Configuration information reported for this nodeconfiguration
Report on this node's sensor status. Depending on the node type, all available “live”
sensors are reported. Select the status information URL for detailed information.
Environment
LSF master demon and report status. Causes LSF master failover, if requiredLSF Failover Monitor
Report this node's most recently collected load average. Alerts are generated based
on thresholds defined in /opt/hptc/nagios/etc/nagios_vars.ini
Load Average
Reports on the status of the Nagios master and monitor daemons across the HP XC
system. Nagios daemons run only on service nodes. Smaller systems may have only a
single master on the head node.
Nagios Monitor
Reports and alerts based on this node's process counts, total, user, and zombie
processes. System uptime
NodeInfo
Interconnect ping checkPING Interconnect
Reports and alerts based on this node's power status and management port ping status.Power
Collects and gathers the power status for this monitor/masters set of managed nodes
(domain). Individual node status is displayed through “Power” status above.
Power Monitor
Collects and gathers resource (squeue) information for this monitor/masters set of
managed nodes (domain). Individual node status is displayed through “Resource Status”
below.
Resource Monitor
Reports and alerts based on this node's resource usage.Resource Status
Verifies root ssh configuration files are synchronized across the HP XC system.Root key synchronization
Collects and gathers resource (sinfo) information for this monitor/masters set of
managed nodes (domain). Individual node status is displayed through “SLURM Status”
below
SLURM Monitor
Reports and alerts based on this node's SLURM statusSLURM Status
Gathers supermon metrics for this monitor/masters set of managed nodes (domain).
loadave, environmental, node info data is collected via this plugin and stored to the
management database.
Supermon Metrics Monitor
Monitors the consolidated log based on patterns in the
/opt/hptc/nagios/etc/syslogAlertRules file. Individual per-node results are
reported through “Syslog Alerts” below.
Syslog Alert Monitor
Report and alert based on this node's syslog alert matchesSyslog Alerts
System free space reported by Supermon for this node.System Free Space
Reports on Procurve switch status including available sensor information as well as
checks each port for low speed connections.
clusternecs1-1
The HP XC Nagios configuration is designed so that you can customize it as needed. You can find the
complete documentation for customizing Nagios on the Nagios Web site:
www.nagios.org
The Nagios system has a Web interface for the information gathered. The Web interface is available over
a secure connection. Enter the following URL in your browser to access the Nagios main window:
https://fully-qualified-HP_XC-hostname/nagios
Figure 6-2. illustrates the Nagios main window.
Monitoring Tools 63