
HP Workgroup System and XC Software Installation Guide Version 1.0

• The run number, which represents the number of times the OVP has been run. The run
number is not included for the first run.
For example, the log file name ovp_ n16_070607.log indicates that this is the first run
of the OVP on July 06, 2007, on head node n16.
5. For more information about troubleshooting failed test results, see HP XC System Software
Installation Guide.
For information about verifying individual cluster components on demand, see ovp(8) and
the HP XC System Software Administration Guide.
If you receive errors or warnings from the OVP, try synchronizing the nodes:
# setnode --resync --all
5.12 Nagios Web Interface
Nagios is the system and network health monitoring application on an HP XC system. It watches
hosts and services and alerts you when problems occur or are resolved.
TIP: HP recommends that you start up the Nagios web interface now to view the network and
ensure that all hosts and services are in the green state.
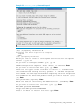
To open the Nagios web page, follow these steps:
1. Open a browser on the head node.
2. Enter the following web address in the Address field:
https://fully_qualified_HP_XC_hostname/nagios
3. When prompted, log in as the nagiosadmin user and specify the Nagios administrator
password.
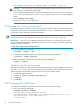
If the hardware configuration contains less than 100 nodes, the Service Detail view provides
a good overview of the system. It lists the Nagios hosts and shows their status.
The Service Problems view is more useful for hardware configurations with hundreds or
thousands of nodes. It provides a practical overview of the system.
For more information about how to use Nagios, see the HP XC System Software Administration
Guide.
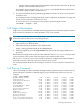
5.13 The nrg Command
The nrg command uses data collected by the Nagios utility to generate reports. Use the summary
option to display a summary of defined Nagios services and the state of those services. For
example:
# nrg --mode summary
Apache HTTPS Server 1-Ok 0-Warn 0-Crit 0-Pend 0-Unk
configuration 10-Ok 0-Warn 0-Crit 0-Pend 0-Unk
Configuration Monitor 1-Ok 0-Warn 0-Crit 0-Pend 0-Unk
Environment 10-Ok 0-Warn 0-Crit 0-Pend 0-Unk
Host Monitor 1-Ok 0-Warn 0-Crit 0-Pend 0-Unk
IP Assignment - DHCP 1-Ok 0-Warn 0-Crit 0-Pend 0-Unk
Load Average 10-Ok 0-Warn 0-Crit 0-Pend 0-Unk
LSF Failover Monitor 1-Ok 0-Warn 0-Crit 0-Pend 0-Unk
Nagios Monitor 1-Ok 0-Warn 0-Crit 0-Pend 0-Unk
NodeInfo 10-Ok 0-Warn 0-Crit 0-Pend 0-Unk
PING Interconnect 10-Ok 0-Warn 0-Crit 0-Pend 0-Unk
Resource Monitor 1-Ok 0-Warn 0-Crit 0-Pend 0-Unk
Resource Status 10-Ok 0-Warn 0-Crit 0-Pend 0-Unk
Root key synchronization 1-Ok 0-Warn 0-Crit 0-Pend 0-Unk
Sensor Collection Monitor 1-Ok 0-Warn 0-Crit 0-Pend 0-Unk
5.12 Nagios Web Interface 37