
HP XC System Software Administration Guide Version 2.1
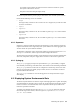

define service{
use nagios
host_name %HOST%
name gatherSensors
service_description Gather supermond sensors
is_volatile 0
check_period 24x7
max_check_attempts 3
normal_check_interval 60
retry_check_interval 2
contact_groups admins
notification_interval 240
notification_period 24x7
notification_options w,u,c,r
check_command getMetrics!sensors
register 1
}
i. Save the file.
3. Invoke the following command to reconfigure the Nagios s
ervice:
# service nagios nconfigure
4. Restart the Nagios service:
# service nagios restart
5. You can verify success by the following methods:
• Check for the existence of the /opt/hptc/database/metrics.tgz f ile and
make sure that it has the proper time stamp.
_____________________ Note _____________________
This file name shown here is the default path name for th
e metrics
data file.
• Monitor the size of the /var file syst em with the df comm and.
•Usetheshownode metrics sensors comm and to display the metrics data
currently in the cmdb.
6.6 Logging Node Events
The syslog-ng program is a flexible and scalable audit trail processing tool, and it provides a
centralized, securely stored log of all devices on your network. This tool completely replaces
syslogd; running b o th syslog-ng and syslogd on the sam e system causes a deadlock,
hanging the system.
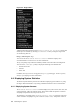
The /opt/hptc/syslog-ng/etc/syslog-ng.conf file defines a series of rules on
how to handle messages logged in the system. The syslog-ng.conf file is divided into five
sections:
Options Defines generic information like re- conn
ection time-outs, FI FO
size limits, and so on.
Sources
Defines the different sources from wh
ich the messages are ob tain ed.
Filters Define the rules to segregate messag
es. F or example, messages can
be separated by host, severity, faci
lity, and so on.
6-10 Monitoring the System