
HP XC System Software Administration Guide Version 2.1
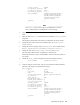

contact_groups admins
notification_interval 240
notification_period 24x7
notification_options w,u,c,r
check_command getMetrics!paging!cpuinfo!
cputype!btime!processes!
netinfo!meminfo!swapinfo!
time!switch!cputotals!
sensors!avenrun
register 1
}
_____________________ Note _____________________
The check_command en tr y of the service definition s is a one-line
entry. It is displayed here on multiple lines to fit on the page.
b. Copy the e ntire gatherMetrics service definition and paste it immed iatel y after
itself.
c. D e lete the string sensors! from t he fir st service def inition’s check_command
assignment.
This step allows all the other m etrics data to be collected at the current interval.
d. Change the name of the second service definition from gatherMetrics to
gatherSensors.
e. Change the service description of the gatherSensors service definitio n from
Gather supermond metrics to Gather supermond sensors.
f. Change the value of the normal_check_interval from 5 to 60.
This step ensures that the metrics a re gathered at 1 hour intervals.
The 60 minu te i nterval is only a recommen dation. Decide on the correct value for
your system.
g. Change the check_command assignment so that it only addresses sensors:
check_command getMetrics!sensors
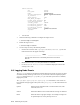
h. Verify the ch a nges you have made. The service descriptions should r esem ble the
following. The changes are represented in bold type.
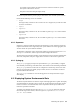
define service{
use nagios
host_name %HOST%
name gatherMetrics
service_description Gather supermond metrics
is_volatile 0
check_period 24x7
max_check_attempts 3
normal_check_interval 5
retry_check_interval 2
contact_groups admins
notification_interval 240
notification_period 24x7
notification_options w,u,c,r
check_command getMetrics!paging!cpuinfo!
cputype!btime!processes!
netinfo!meminfo!swapinfo!
time!switch!cputotals!
avenrun
register 1
}
Monitoring the System 6-9