
HP XC System Software Administration Guide Version 2.1
6.4.4 Monitoring Paging and Swap Data from the Co
mmand Line
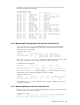
The shownode metrics paging com mand displays the pag ing data for the node on
which this comman d is issued.
# shownode metrics paging
Timestamp |Node |pgpgin |pgpgout |pswpin |pswpout
-----------------------------------------------------------------
date and time stamp |n5 |6098711 |21758456 |175 |1044
The shownode metrics swap command displays swap space total and usage for the node
on which the command is issued.
# shownode metrics swap
Timestamp |Node |Total |Used |Free |Page Cache
-------------------------------------------------------------------
date and time stamp |n5 |2097120 |4048 |2093072 |438601
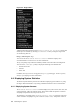
6.4.5 System Monitoring with the Nagios GUI
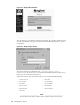
The Nagios GUI displays a series of wi ndows that provide system statistics. The foll owi ng is a
list of Nagio s menu items and their corresponding windows:
Menu Item
Corresponding Window
Tactical Overview Tactical Monitoring Overview
Service Detail Service Status Details For All Hosts
Host D etail Host Status Details For All Host Groups
Status Overview Service Overview For All Host Groups
Status Summary
Status Summary For All Host Groups
Status Grid Status Grid For All Host Groups
Status Map
Network Map for All Hosts
You can find additional information on the Nagios utility by selecting Documentation on
the Nagios menu; see Figure 6-4 .
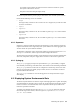
6.5 Customizing Nagios Metrics Gathering
The nagios_template.cfg file specifies which metrics are gathered and how often. A
single Nagios service definition calls for sensor data and other metrics to be gathered with
thesamefrequency.
The following procedure enables you to edit the file and to apply two servi ce definitions: one
for the sensor data and the other for all other metrics.
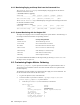
1. Log in as the sup eruser (root) on the h ead node.
2. Use the text editor of your choice to edit th e /opt/hptc/nagios/etc/tem-
plates/nagios_template.cfg file as follows:
a. Locate the gatherMetrics service definition, as shown here:
define service{
use nagios
host_name %HOST%
name gatherMetrics
service_description Gather supermond metrics
is_volatile 0
check_period 24x7
max_check_attempts 3
normal_check_interval 5
retry_check_interval 2
6-8 Monitoring the System