
HP XC System Software Administration Guide Version 2.1
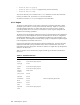
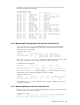
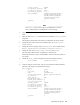
displayed in degrees Celsius, and fan speeds are
noted in terms of revo lutions per m in ute.
Portions of this output were trun cated .
# shownode metrics sensors
Timestamp |Node_Id |Name |Value |Description
-----------------------------------------------------------------------
date time |n16 |Chassis Intrus |0 |(sensor value out of range)
date time |n16 |Chassis Open |0 |Deasserted
date time |n16 |Security |0 |(sensor read returns no data)
date time |n16 |Power Button |0 |Button press - power
date time |n16 |Clear CMOS Jmpr |0 |Deasserted
date time |n16 |Safe Mode Jmpr |0 |Deasserted
date time |n16 |Clr Passwd Jmpr |0 |Deasserted
date time |n16 |Rsvd Jmpr |0 |Deasserted
date time |n16 |Rsvd2 Jmpr |0 |Deasserted
date time |n16 |Watchdog Timer |0 |(sensor read returns no data)
date time |n16 |Power Button |0 |(sensor value out of range)
date time |n16 |Wake-on-LAN 100 |0 |Deasserted
date time |n16 |Wake-on-LAN 1Gb |0 |Deasserted
date time |n16 |Cooling 1 (Sys) |0 |Severity Event - Transition
date time |n16 |Cooling 2 (Mem) |0 |Severity Event - Transition
date time |n16 |Cooling 3 (Disk) |0 |Severity Event - Transition
date time |n16 |Ambient Temp |27 |deg C; <= lower non-critical
date time |n16 |Processor 0 Temp |67 |deg C; <= lower non-critical
date time |n16 |Processor 1 Temp |67 |deg C; <= lower non-critical
date time |n16 |Fan 1R Tach |2730 |rpm
date time |n16 |Fan 1L Tach |2700 |rpm
date time |n16 |Fan CPU0 Tach |3390 |rpm
date time |n16 |Fan CPU1 Tach |3510 |rpm
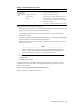
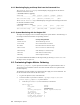
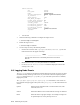
6.4.2 Monitoring CPU Usage and Load from the Command Line
The shownode metrics cpus command displays the nice value as well as the user,
system, and idle times (in milliseconds) for each processor on the node from which this
command is i ssued. For example:
# shownode metrics cpus
Timestamp |Node |CPU# |User |Nice |System |Idle
----------------------------------------------------------------------
date and time stamp |n5 |0 |3290175 |7837 |873984 |856981797
| |1 |3364908 |5633 |834517 |856303133
The shownode metrics cputotals com m and also
displays the n ice value as well as the
user, system, and idle tim es (in ms), and for
the n ode as a whole. For example:
# shownode metrics cputotals
Timestamp |Node |User |Nice |System |Idle
-------------------------------------------------------------------------
date and time stamp |n5 |6655083 |13470 |1708501 |1713284930
The shownode metrics load command displays 1-, 5-, and 15-m inute processor load
averages for the node on which this command is issued. F or exam ple:
# shownode metrics load
Timestamp |Node |ar0 |ar1 |ar2 |# Running |# thre
ads
------------------------------------------
---------------------------------
date and time stamp |n5 |0 |0 |0 |8 |5807
The columns for ar0, ar1,andar2 indicate the load average for 1 minute, 5 minutes, and
15 minutes, respectively.
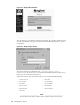
6.4.3 Monitoring Memory from the Command Line
The shownode metrics mem command displays memory total and u sage information for
the node on which this command is issued.
# shownode metrics mem
Timestamp |Node |Total |Used |Free |Buffer |Shared |Total High|Free High
---------------------------------------------------------------------------------------
date and time stamp|n5 |8285616 |8076288 |209328|356720 |0 |0 |0
Monitoring the System 6-7