
HP XC System Software Administration Guide Version 2.1
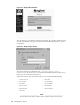
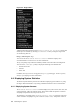
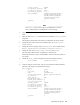

Figure 6-4: Nagios Menu
Additional informa tio n about the Nagios Service Status for All Hosts window and
related topics are available by selecting Documentation and by visiting the Nagios Web
site at following Web site:
http://www.nagios.org .
You can also use the shownode metrics sensors command to display some
environmental data. See Section 6.4.1 for more information.
The hpasm package is provided and enabled by default on all nodes with iLO management.
You can use the /sbin/hplog utility to display the following envir onmental data:
• Thermal sensor data
•Fandata
• Power data
In addition, most hpasm errors are l ogged to the syslog system logger. See the hpasm
(4)
and hplog(8) manpages for more information.
6.4 Displaying System Statistics
The HP XC System Software provides two methods for displaying system statistics: by using
the Nagios Web-based interface or by issuing commands issued from a host’s command line.
6.4.1 Displaying System Sensors
The shownode metrics sensors comm and displays the system sensors, their value, and
a brief de scr iption, with a d ate and time stamp. Sensor data includes the position of switches
and jumpers, temperature data, f an speeds, and so on.
The following is an example of the shownode metrics sensors comm and. Notice that
values of switches and jumpers are given in term s of 0 (off) or 1 (on). Temperature values are
6-6 Monitoring the System