
HP XC System Software Administration Guide Version 2.1
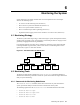

For example, Nagios monitors the four hosts and t
wo switches in an HP X C system,
and reports on the status of six hosts.
Keep this in mind when u sing the Nagios utility.
The HP XC System Softw are provides plug-in s that monitor these and other system statistics.
Ensure that the following services are avail
able:
• httpd
The Nag ios utility continues to run even if this service is stopped, but yo u will not be able
to use the web interface.
• nagios
• supermon
The Nagios utility con tin ues to run, but it is u nable to gather supermon metrics without
this service.
• supermond
The Nagios utility con tin ues to run, but it is u nable to gather supermon metrics without
this service.
6.2.3 Supermon
Supermon is a high ly-scalable, hig h-sp eed cluster monitoring system. Supermon provides a ll
required node statistics to the Nagios subsystem. System statistics are tiered, aggregated, and
stored in the H P XC System Software database.
The Supermon components cons ist of the kernel modules to generate the statistics, the mond
and supermond daemons, and the script to load and configure the daemons.
The data collected by Supermon incl
udes system performance metrics and environmental data,
such as fan, temperature, and powe
r supply status. This data is collected on a regular basis.
6.2.4 Syslog-ng
The syslog-ng logging tool impr
oves upon trad itional syslog functionality. It supplies
more flexibility to handle logs
, adds better filters, and contains a better forwarding mechanism.
The syslog-ng daem ons on each node are configured in a tiered setup, where som e of the
nodes are log aggregators for smaller groups of n odes, that serve as forwarders of selected
log information to the head node.
The syslog-ng events that are received and logged are also incorporated into a Nagios
status display.
6.3 Displaying System Environmental Data
The HP XC System Software also uses the Nagios m onitoring application to g ather and display
environmental data on XC6000 systems. The HP X C System Software provides plug-ins that
monitor each node’s environm ental data, such as tem perature and fan speed, which can be
indicators o f possible nod e failu re.
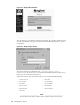
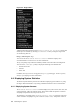
To display en vir onmental data, fir st select the Service Problems menu item in the left
frame of the Nagios main w ind ow, sho wn in Figure 6-4, to op en the Service Status
for All Hosts window.
Monitoring the System 6-5