
HP XC System Software Administration Guide Version 2.1
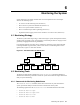
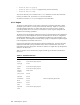
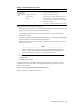
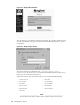
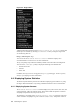

Table 6-1: Monitored Services (cont.)
Service
Function
Comments
Fan events
Reports on failures and removal
Temperature sensors
Reports on overheated sensors
Power supply Reports on power supply failures and removal
Environmental
(supported only
on the X C6000
only)
Other Reports single— bit m emory errors, and also
performs online spare switchovers if that feature
is enabled in RBSU
Also reports on double bit NMIs, when possible
Additional Nagios features inclu de the following:
• Monitoring of network services (for exam ple, SMTP, P OP3, HTTP, NN TP, PING, and so on)
• Monitoring o f host resources (processor load, disk usage)
• A simple plug-in design that allows users to develop their own service checks easily
• Parallel service checks
• The ability to define network host hierarchy using parent hosts, detecting and distinguishing
among hosts that are down and those that are unreachable
• Contact notification, by w a y of e m ail o r p ager, when service or host problems occur and
when they are resolved
_______________________ Note _______________________
Nagios is configured to send mail to the Nagios administrator (the user name is
nagiosadmin), which results i n a large dead letter file if left unmanaged. Be
sure to read the mail o r to forward it to your own email account.
• The ability to define event handlers to be run during service or host events for proactive
problem resolution
• Automatic log fi le r otat ion
The Nagios system has a Web interface for the inform ation gathered. The Web interface
is available over a secure connection. Enter the following URL in your browser to access
the Nagios main window:
https://fully-qualified-HP_XC-hostname/nagios
Figure 6-2 illustrates the Nagios main window.
Monitoring the System 6-3