
Configuring HP WebQoS for HP-UX

Using HP WebQoS
Monitoring SLOs and the History Log
Chapter 4 97
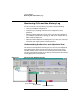
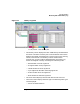
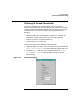
Figure 4-2 History Log View
• The Severity column displays the color coded severity associated with
the events. The Status summary bar across the bottom of the screen
displays the number of events that are critical, major, minor, warning,
normal, and unknown. The Severity Column and the Status
summary bar are color coded as described below. The History log
events are assigned a severity according to the following rules:
— Red: Number of critical log entries
— Orange: Number of major log entries
— Yellow: Number of minor log entries
— Cyan (light blue): Number of warning log entries
— Green: Number of normal log entries
— Blue: Number of unknown log entries
• The Time column displays the time and date an event occurred.
• The Event column displays the event type. The following event types
can be displayed:
— SLO or threshold violation
Severity Column
Status Summary Bar