
Configuring HP WebQoS for HP-UX

Using HP WebQoS
Monitoring SLOs and the History Log
Chapter 496
• Status summary bar — Displays the number of SLOs and thresholds
that are violated (red), in violation but with corrective actions being
taken (yellow), in compliance (green), inactive (blue), not connected
(aqua), never connected (orange), and in error (red). The status
summary bar is color coded with the same scheme as the status
column described above.
• Priority column — Displays the SLO or threshold priority, for
example 1, 2, 3, or 4. WebQoS performs corrective actions defined for
the highest priority SLO or threshold policy (1) that is currently
violated.
• Component column — Displays the site associated with the SLO or
threshold.
• Objective column — Displays a one line description of the SLO or
threshold.
• Status summary bar — Displays the number of SLOs and thresholds
of each status. The status summary bar is color-coded with the same
scheme as the status column described above.
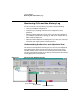
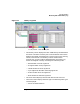
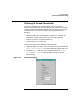
Understanding the History Log View
The history log view (Figure 4-2, History Log View) displays a history of
SLO, threshold, corrective action and process group events for the site or
service selected in the Service/Systems view.
NOTE The management user interface uses the local time zone. If the system
where you installed the management user interface is in a different time
zone than the web server and application server, the time stamps are
formatted using the local time of the management user interface.
The history log provides information about the effectiveness of the
system’s process group configuration. It also shows which corrective
actions have been taken. The history log entries have time stamps so you
can tell how long an SLO or threshold has been violated.
You can use the history log to determine performance trends. You can see
how often the objectives of a system, service, or site have not been met
over time (for example, during the past month).