
Configuring HP WebQoS for HP-UX


Customizing and Using HP OpenView with HP WebQoS
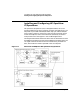
Installing and Configuring HP OpenView IT/Operations
Chapter 5134
su root
cd /var/opt/webqos/stats
ln -s SomeServiceName.stat qos.stat
When the ITO templates open the file qos.stat, they will really be
reading from the statistics file you selected. In the example above, the
WebQoS service name is SomeServiceName.
Customizing the ITO Templates
The ITO templates shipped with WebQoS reside in the template group
WebQoS. There are three classes of ITO templates:
• Event templates—operate automatically and will probably require
little or no customization. The WebQoS events monitored are Policy
Events (SLO and Thresholds), Corrective Actions, and Denial of
Service Events.
• Status templates—operate automatically and will probably require
little or no customization.
• Statistic threshold monitors—will need customization if you wish to
monitor statistics for more than one WebQoS service. Follow the steps
below. (If you wish to monitor just one WebQoS service, see the
previous section, “Getting a Quick Start” on page 133.)
The WebQoS service statistics that are monitored are:
current number of sessions
number of deferred sessions in last 30 minutes
current number of redirections
current number of rejections
current number of sites in violation
current number of sites in error state “other”
average response time (low request class)
current number of deferred sessions (low request class)
average deferral time (low request class)
The statistics are logged in the file
/var/opt/webqos/stats/servicename.stat where servicename is the
name of the service configured in the management user interface. For
information on WebQoS service statistics logging, see “To Configure
Service Statistics Logging” on page 47 in this manual.
ITO templates are not provided for each statistical value. You may want
to create your own templates by following the format of the statistics