
Configuring HP WebQoS for HP-UX
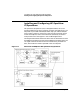

Customizing and Using HP OpenView with HP WebQoS
Installing, Configuring and Using PerfView
Chapter 5 131
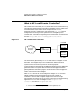
a. Click on the desired data source.
b. In the Metric List dialog that pops up, select the desired
metrics.
You can select system variables such as GBL_DISK_UTIL_PEAK and
WebQoS variables such as Sessions. Graphing system variables
with WebQoS variables helps in detecting a correlation between
system performance and web performance. This aids in system
performance tuning.
c. When you have selected the desired variables, click the Draw
button.
TIP Graphing too many variables at once produces an unreadable graph. You
can increase the readability of a graph by increasing the thickness of
each line plotted using “Change Visual Effects” on the Settings menu.
You can also increase the readability of a graph by changing the
resolution from minutes to hours, using the “Points every...” option on the
Settings menu.