
Configuring HP WebQoS for HP-UX

Using HP WebQoS
Displaying Site Statistics
Chapter 4 105
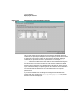
queues, displayed as the percent full. Note that there is a separate
queue for each request class. Typically the queues are reported to
be 0% full, because the web server removes each request from a
queue as soon as it is added to the queue. A queue will be more
than 0% full if there is a large burst of incoming requests, or if the
web server is overloaded. There may be up to a 30 second delay in
reporting the queue utilization.
• The aggregate number of outstanding deferred sessions. This is
the number of deferrals that are outstanding at a given instant of
time. It is incremented every time a deferral is initiated. The total
is adjusted after the reservation time specified for the deferred
session has expired. It is updated to shared memory every 30
seconds.
• The current defer time, displayed in seconds.This is the defer time
that the last defer session received. It is logged every time a defer
event occurs, and is reset when the SLO is in compliance.
• The average defer time for the last 30 minutes, displayed in
seconds. The data is collected every 30 seconds, and the average is
updated.
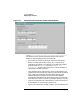
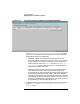
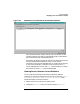
Viewing Site Session Control Statistics
You can view the percentage of new sessions admitted, deferred,
redirected, or rejected per Request Class from the Site Performance
Statistics Session Control Statistics screen by following these
steps:
1. Select a site in the Services or Systems view.
2. Choose the Statistics task icon from the task bar or Actions:
Statistics. The Site Performance Statistics window displays.
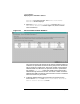
3. Select the Session Control Statistics tab from the Site
Performance Statistics window (Figure 4-6, Site Session Control
Statistics Screen).