
HP Web Jetadmin - Performance and Threadpools in HP Web Jetadmin
Alerts
Subscribing to a simple set of alerts (Paper Out, Toner Low, Toner Out, Offline, Printer Error,
Intervention Needed, Paper Jam, Cover Open, and Manual Feed Needed) can cause varied system
resource usage during this time, dropping to Fluctuating Moderate for short periods or running up to
Severe High for short periods. The majority of the time it runs at Fluctuating High resource usage.
After completion, it drops back down to Light resource usage.
Fluctuating High to Light when complete
Processing alerts usually involves device polling that is dictated either by traps or an adaptive/static
polling rate. HP FutureSmart devices use Web Services Eventing to process alerts. In all cases,
resource usage remains acceptable unless pollers become overloaded.
Light to Fluctuating Moderate
Firmware
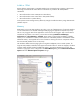
Populating firmware information on the Firmware tab can spike due to the size of the files being
imported. Downloading firmware is typically light on system resources as it involves opening a Port
9100 TCP connection and sending down an RFU file for many devices. HP FutureSmart devices use
Web Services for upgrades.
Light to Fluctuating Moderate (when running eight concurrent upgrades)
SIZING EXAMPLES
While it is difficult to provide exact recommendations as all installations vary, the HP Web Jetadmin
team has run many tests to provide examples of what can be performed before performance
degrades under certain scenarios. The team benchmarked the following scenarios to attempt to
determine the tipping point when HP Web Jetadmin performance degrades.
Test Plan Platforms—all systems running Windows 2003 R2
8 VMs running base hardware configuration – Dual core processor with 4 GB RAM; client,
server, and DB running on the same system
1 VM running base configuration with off-box DB
1 VM running a quad processor with 12 GB RAM
Test Plan Scenarios
Two of the machines performed Discovery (one with a device list of 1,100 and the other with a
device list of 4,000).
Two of the machines configured Alerts that began at a safe level and slowly increased until a
failure point was encountered (one with a device list of 1,100 and the other with a device list of
4,000). The Alerts exercised were General Alerts with the options of Advisory, Media Path, and
Supplies.
Two of the machines performed Data Collections that began at a safe level and slowly increased
until a failure point was encountered (one with a device list of 1,100 and the other with a device
list of 4,000).
Two of the machines performed Data Collections with Hourly Peak Usage exclusively (one with a
device list of 1,100 and the other with a device list of 4,000). This is due to early experiments
showing that this particular collection presents a heavy load due to the frequency of queries to the
devices.