
User's Manual

Example 2 Sample wrapper script
$ cat cadvise_cc
#!/bin/sh
#
# wrapper script to invoke cadvise
#
exec /opt/cadvise/bin/cadvise -pdb mypdb +wlint /opt/ansic/bin/cc "$@"
Now cadvise_cc can be used instead of cc in the build line to invoke cadvise analysis in
addition to the compilation process.
NOTE: You need not create separate dependency rules for cadvise in the makefiles. Cadvise
must be invoked only when the existing dependency rules in the makefile lead to a compile.
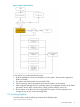
The addition of cadvise analysis to the build process increases the total build time. You can either
invoke cadvise automatically whenever compiled, or launch cadvise as a separate build process
by invoking it explicitly. For large projects where a lot of cross-file analysis is required, it is better
to separate the analysis process. You can use the -crossfile option to manage the cross-file
analysis.
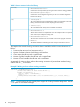
2.6 Enabling different categories of diagnostic messages
By default, a limited number of diagnostic messages are enabled in cadvise.
Additionally, the following options can be used to enable various types of diagnostic messages.
Enables all the warnings about potentially questionable constructs in the
compiler.
+w
Enables all the compile time checks.+wall
Detects code fragments which are endian dependent.“+wendian” (page 51)
Provides compile-time diagnostics which detect potential errors in the source
code.
“+wlint” (page 45)
Detects multi-threaded programming issues.“+wlock” (page 53)
Enables compile time diagnostic messages for potential security vulnerabilities.“+wsecurity[=1|2|3|4]” (page 52)
Enables warnings that help detection of potential problems in converting 32-bit
applications to 64-bit.
“+w64bit ” (page 51)
Generates performance advisory diagnostics.“+wperfadvice[=1|2|3|4]
” (page 54)
The best method is to use +wall to enable all possible diagnostic messages. Then, use the cadvise
report -pdb <pdbname> -summary command to see a quick summary of the various
diagnostic messages generated by cadvise, sorted by severity. For more information, see Generating
Reports (page 27).
2.7 Generating code complexity metrics
Cadvise can generate code complexity metrics to gauge the complexity of the code being developed
or migrated. The +metrics option generates program complexity metrics.
Syntax:
$cadvise +metrics[=ict][:out=pdb]
OR
$cadvise +metrics[=ict][:out=[+]<filename>]
Following command shows the examples for generating code complexity metrics.
2.6 Enabling different categories of diagnostic messages 13