
Guidelines for Configuring Virtual Partitions on Cellular Platforms

12
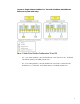
• 4B – Two virtual partitions / two-cell nPartition (each virtual partition has 24GB CLM
(on the cell with workload’s I/O), 8 cores from remote cell, 8GB ILM, 100% Base
memory, 1024MB granule size)
• 4C – Two virtual partitions / two-cell nPartition (each virtual partition has: 4
cores/cell , 32GB ILM, 100% Base memory, 1024MB granule size)
Analysis of Results
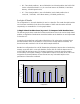
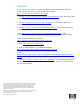
The configuration 1A (one-cell nPartition) is used as a baseline. The results from this baseline
run for the two workloads (in the form of the number of SAPS and the number of BOPS
respectively) are normalized to 1 in the graphs below.
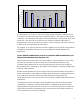
I) Single Virtual Partition Runs (Layouts 1-3) Compared with Baseline Runs
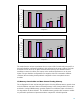
The first two graphs show results from all the runs that were done in the various single virtual
partition configurations. Results were normalized relative to the baseline run and represented
as fractions of 1.
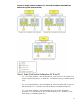
Comparing the results from configuration 1B with that of 1A gives us the overhead due to
the vPars software stack (in the absence of any resource locality related overheads). As
shown below this overhead is 1% for both these sample workloads.
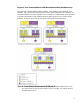
Results from configurations 2A and 2B illustrate the performance impacts due to interleaving
memory across the cells in a two-cell nPartition. For the SAP SD 2-tier the impact was 4%
and for SPECjbb the impact was 7%. Memory interleaving causes the average memory
access latency to be higher resulting in a performance impact. The locality of the CPU cores
assigned to the virtual partitions did not seem to have any noticeable impact on the
performance of these two workloads.
SAP SD 2-tier
1
0.99
0.96 0.96 0.96
0.99
0.92
0.88
0.9
0.92
0.94
0.96
0.98
1
1.02
1A(nPar) 1B(vPar) 2A 2B 3A 3B 3C
configurations
normalized SAPs