HP-UX WBEM SysFaultMgmt (System Fault Management) (SFM) Administrator Guide HP-UX 11i v3 HP Part Number: 5900-3285 Published: September 2013 Edition: 2
© Copyright 2013 Hewlett-Packard Development Company, L.P Legal Notices © Copyright 2003, 2013 Hewlett-Packard Development Company, L.P. Confidential computer software. Valid license from HP required for possession, use or copying. Consistent with FAR 12.211 and 12.212, Commercial Computer Software, Computer Software Documentation, and Technical Data for Commercial Items are licensed to the U.S. Government under vendor’s standard commercial license.
Contents HP secure development lifecycle......................................................................7 1 Introduction...............................................................................................8 Overview................................................................................................................................8 Features and benefits................................................................................................................
Viewing FRU information.....................................................................................................50 Viewing information about Management Processor.................................................................51 Viewing information about Mem Error................................................................................114 Viewing information about Firmware information....................................................................
Searching Low Level Logs using CLI..................................................................................69 Viewing List of Low Level Logs..............................................................................................70 Viewing List Of Low Level Logs using GUI.........................................................................70 Viewing List Of Low Level Logs using CLI...........................................................................
Power supply instances..........................................................................................................109 Temperature instances...........................................................................................................110 Voltage instances..................................................................................................................111 FRU Information instances........................................................................................
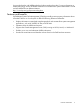
HP secure development lifecycle Starting with HP-UX 11i v3 March 2013 update release, HP secure development lifecycle provides the ability to authenticate HP-UX software. Software delivered through this release has been digitally signed using HP's private key. You can now verify the authenticity of the software before installing the products, delivered through this release. To verify software signatures in signed depot, version B.11.31.1303 or later of Software Distributor (SD) and version A.01.01.
1 Introduction This document is about administration and the most recent product information on HP-UX WBEM SysFaultMgmt, also known as System Fault Management or SFM, which is supported on HP-UX 11i v3 operating systems. Table 1 (page 8) lists the product version for which the document is applicable. Table 1 Documentation Support forSysFaultMgmt (System Fault Management) (SFM) Operating system Version HP-UX 11i v3 C.07.11.08.
You must be familiar with WBEM technology before reading this guide. For more information on WBEM technology, see the HP WBEM Services for HP-UX and Linux System Administrator's Guide and HP WBEM Services Release Notes at: http://www.hp.com/go/hpux-networking-docs Features and benefits SysFaultMgmt (System Fault Management) (SFM) dynamically queries property information about a hardware device on a local system.
Components of SysFaultMgmt (System Fault Management) (SFM) This section discusses the following topics: • EVWEB • Error Management Technology (EMT) • CIMUtil • IPMI Event Viewer • providers EVWEB EVWEB is a component of SysFaultMgmt (System Fault Management) (SFM) that enables you to administer and view WBEM indications generated on the local system on which SysFaultMgmt (System Fault Management) (SFM) is installed. For more information on EVWEB, see “Evweb overview” (page 53).
Table 2 Instance providers (continued) Instance provider Description • Blade Serial number • Blade Part number • Blade Status NOTE: The Blade instance provider is available on HP Integrity BL860c i2/BL870c i2/BL890c i2 Server Blades, HP Integrity Superdome 2, HP Integrity BL860c i4, BL870c i4, BL890c i4, rx2800 i4 and rx2900 i4.
Table 2 Instance providers (continued) Instance provider Description Filter Metadata (FMDProvider) The FMD instance provider does the following: • Provides the ability to predefine a filter in a repository • Ensures that chosen indications are logged to the Event Archive • Creates HP-advised subscriptions when SysFaultMgmt (System Fault Management) (SFM) is installed FirmwareRevisionProvider The Firmware Revision provider retrieves the following types of information: • System firmware revision • Manage
Table 2 Instance providers (continued) Instance provider Description The ComputerSystem Chassis provider provides the following details related to the logical server: • VirtualSerialNumber • VirtualUUID These values are retained when an OS instance is moved to another server. Consolidated Status provider The Consolidated Status provider provides the overall health status of various subsystems of the managed node.
Table 3 Indication providers (continued) Indication provider Description • CMC Monitor (cmc_em) • Itanium Core Hardware Monitor(ia64_corehw) • Itanium Memory Monitor (memory_ia64) NOTE: This provider and WBEM to EMS Consumer is not supported on HP Integrity BL860c i2, BL870c i2 & BL890c i2 Server Blades, HP Integrity rx2800 i2 server, HP Integrity Superdome 2, HP Integrity BL860c i4, BL870c i4, BL890c i4, rx2800 i4 and rx2900 i4. For a list of EMS Event Descriptions, see: http://www.hp.
Table 3 Indication providers (continued) Indication provider Description example, if the name of the provider displayed in the event details is MemoryIndicationProviderIA, the event is related to memory. For a complete list of the names of providers displayed in the WBEM indication details, in the SysFaultMgmt (System Fault Management) (SFM) mode, see Table 8 (page 44). The provider names indicate the device to which the event is related.
Table 4 Instance / Indication providers support (continued) Instance / Indication providers PA-RISC provider IA legacy provider1 IA NGIS providers2 rx2800 i2, rx2800 i4 and rx2900 i4 EnclosureProvider and EnclosureStatusProvider Х √ √ MPProvider and MPStatusProvider √ √ √ CSChassisProvider √ √ √ RecordLogProvider √ √ √ FRUProvider √ √ Supported only on HP Integrity BL860c i2, BL870c i2, BL890c i2, BL860c i4, BL870c i4, & BL890c i4 √ Not supported on HP Superdome 2 EMSWrapperProvider
Table 5 Mapping provider module and provider (continued) Provider Module Provider registered with CIMOM Provider name in Events ChassisIndicationProviderPA CoreHardwareIndicationProviderIA new lists the Detection Policy of providers in SFMIndicationProvider.
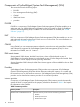
Figure 1 Block Diagram of SysFaultMgmt (System Fault Management) (SFM) The following list describes the sequence of events when a request is made for information: 1. The CIMOM receives requests from the CMS for information about devices. 2. The CIMOM directs the requests to the appropriate SysFaultMgmt (System Fault Management) (SFM) provider, for example, the CPU instance provider. 3. The SysFaultMgmt (System Fault Management) (SFM) provider queries the associated hardware device for property information.
4. The CIMOM directs these indications to EVWEB and to the CMS that has created subscriptions for indications. EVWEB then stores the indications either in the Event Archive, in syslog, or in your E-mail box, or all, depending on your configuration. Indications can be viewed using HP SIM on the remote system and HP SMH on the local system. 5. The indications generated by the SFMIndicationProvider, and reported to the CIMOM, can also be directed to the EMS framework through the WBEM Wrapper Monitor.
2 Installing the SysFaultMgmt (System Fault Management) (SFM) software This chapter discusses the following topics: • “Prerequisites” (page 20) • “Installing the SysFaultMgmt (System Fault Management) (SFM) software from the media” (page 21) • “Installing the SysFaultMgmt (System Fault Management) (SFM) software from the web” (page 25) • “Verifying the installation” (page 26) • “Removing the SysFaultMgmt (System Fault Management) (SFM) software” (page 28) • “Verifying removal of the SysFaultMgmt
• ProviderSvcsBase Version C.12.00.04.01, March 2012 release or later (ProviderSvcsBase C.13.00.06.01, September 2013 release is the latest version) • SysMgmtPlus Version A.04.00, September 2010 release or later • OnlineDiag Version B.11.31.06.xx on HP 9000 systems only, September 2009 release or later (OnlineDiag B.11.31.22.02, September 2013 release is the latest version) EMS Version A.04.20.31 STM Version D.06.
4. 5. 6. In the Specify Source window, select the appropriate location and click OK. The SD Install Software Selection window is displayed. In the SD Install - Software Selection window, select Options-> Autoselect dependencies when marking software. Select Enforce dependency analysis errors in agent, and click OK, as shown in the following figure. The Note window is displayed. Selecting these options automatically installs all the dependencies. NOTE: The system selects some options by default.
The following figure displays the beginning of the configuration phase: When the SysFaultMgmt (System Fault Management) (SFM) software installs, the Install window appears indicating that the SysFaultMgmt (System Fault Management) (SFM) software is installed successfully, as shown in the following figure: Installing the SysFaultMgmt (System Fault Management) (SFM) software from the media 23
9. Unmount the CD. To unmount, enter the following command at the HP-UX prompt: # unmount /tmp/cdrom 10. To verify whether the SysFaultMgmt (System Fault Management) (SFM) software is installed properly, enter the following command at the HP-UX prompt: # swlist | grep SysFaultMgmt If the SysFaultMgmt (System Fault Management) (SFM) software is installed properly, SysFaultMgmt and the version number of the SysFaultMgmt (System Fault Management) (SFM) software are displayed in the output.
Installing the SysFaultMgmt (System Fault Management) (SFM) software from the web The SysFaultMgmt (System Fault Management) (SFM) depot is available for download on the OE media and web.
Verifying the installation This section describes how to verify the SysFaultMgmt (System Fault Management) (SFM) software installation using the TUI and the CLI. Verifying the installation using the TUI To verify the SysFaultMgmt (System Fault Management) (SFM) software installation, complete the following steps: 1. Log in to the system as a superuser. 2. Click Logfile in the Install window, as shown in the following figure: The Logfile, which includes details about the installation, is displayed.
3. For information about errors related to installation, enter the following command at the HP-UX prompt: # swjob -a log @ :/ The jobid is available in the Logfile, as underlined in the Logfile window, in the following figure: For example, enter the following command at the HP-UX prompt: # swjob -a log iemlhamia-0013 @ iemlhamia.india.hp.com:/ Verifying the installation using the CLI To verify your installation using the CLI, complete the following steps: 1.
3. For information about installation-related errors, enter the following command at the HP-UX prompt: # swjob -a log @ :/ For example, enter the following command at the HP-UX prompt: # swjob -a log iemlhamia-0005 @ iemlhamia.india.hp.com:/ NOTE: The logs to /var/opt/sfm/log/install.log are written when SysFaultMgmt (System Fault Management) (SFM) is getting installed. NOTE: Ignore the error Unable to connect to EVM, retrying, and subsequent messages from sfm.
5. Select Actions->Remove, as shown in the following figure: 6.
The following figure is a sample of the removal process in progress: 7.
8. To verify whether the SysFaultMgmt (System Fault Management) (SFM) software is removed properly, enter the following command at the HP-UX prompt: # swlist | grep SysFaultMgmt If the SysFaultMgmt (System Fault Management) (SFM) software is removed properly, SysFaultMgmt and the version number of the SysFaultMgmt (System Fault Management) (SFM) software does not appear in the output.
Verifying removal using the TUI To verify whether the SysFaultMgmt (System Fault Management) (SFM) software is removed successfully, complete the following steps: 1. Log in to the system as a superuser. 2. Click Logfile in the Remove Window. If there are no errors in the Logfile, the SysFaultMgmt (System Fault Management) (SFM) software is removed successfully. If the SysFaultMgmt (System Fault Management) (SFM) software is not removed properly, you must repeat the removal procedure.
3 Configuring indication providers This chapter describes how to configure indication filters, error logging, and the SFMIndicationProvider. Configuring indication filters You must configure the indication filters to view desired indications. You use the Filter Metadata provider (FMD) to configure indication filters that deliver important or desired indications, for example, indications with a certain severity.
Filter Filter Filter Filter Filter Filter Filter Unique Identifier Query Query Language Source Namespace Description State Last Operation : : : : : : : 10002 Select * from HP_AlertIndication where (PerceivedSeverity >= 4) WQL root/cimv2 Admin Filter Enabled Filter State Add Filter HP_AlertIndication is derived from CIM_AlertIndication and HP_DeviceIndication is derived from HP_HardwareIndication. HP_HardwareIndication is derived from HP_AlertIndication.
To check whether the SFMIndicationProvider is working properly, send a memory test event by entering the following command at the HP-UX prompt: # /opt/sfm/bin/sfmconfig -t -m The following output indicates that the SFMIndicationProvider is working properly: Sending test event for memory monitor. NOTE: You can also send test events for other devices that the SFMIndicationProvider monitors. For information on the devices monitored by the SFMIndicationProvider, see Table 3 (page 13).
4 Administering indications and instances using HP SIM This chapter describes SysFaultMgmt (System Fault Management) (SFM) administration on a remote system using HP Systems Insight Manager (HP SIM). NOTE: You can perform similar tasks using other management applications that are compliant with the Common Information Model (CIM) (2.8) schema (or later) of the Distributed Management Task Force (DMTF). The terms events and indications are used interchangeably in this document.
2. To create subscriptions, select Options-->Protocol Settings-->Global Protocol Settings in the HP SIM Home page, as shown in Figure 4-1. Figure 2 HP SIM Home Page The Global Protocol Settings window is displayed, as shown in Figure 4-2. Figure 3 Global protocol settings 3. In Figure 4-2, under default WBEM settings, select Enable WBEM. Click OK to save your settings.
4. Select Configure->Configure or Repair Agents, as shown in Figure 4-3. Figure 4 Configuration The Configure or Repair agents window is displayed, as shown in Figure 4-4. Figure 5 Configure or Repair Agents 5. 38 From the Add targets by selecting from: list in Figure 3-4, select All systems to view and select the systems.
the selected system. The list of systems is displayed in the Select Target Systems window, as shown in Figure 6. Figure 6 Select Target Systems 6. To select all the systems in the network, select the Select “All Systems” itself check box, as shown in Figure 4-5. Click Apply. The Verify Target Systems window is displayed, as shown in Figure 4-6.
7. Select the appropriate check box to verify the target systems and click Next, as shown in Figure 4-6. The Enter credentials window is displayed, as shown in Figure 4-7. Figure 8 Enter credentials 8. Enter your credentials in the given fields, as shown in Figure 4-7. Click Next. The Configure or Repair settings window is displayed, as shown in Figure 4-8. Figure 9 Configure or Repair settings 9. On the Configure or Repair settings window, click Run Now.
Figure 10 Task Results 10. To obtain a printable report of the indication subscription details, click View Printable Report at the bottom of the window. The report is displayed, as shown in Figure 4-10. Figure 11 Printable Report of the indication Subscription NOTE: For more information, see the HP Systems Insight Manager Installation and Configuration Guide for HP-UX at: http://www.hp.
1. Select All Events in the left pane of the HP SIM window. The list of events is displayed, as shown in Figure 4-11. Figure 12 Events list 2. To view the details of an event, select the event. The details are displayed at the bottom of the same window, as shown in Figure 4-12.
3. To obtain the printable version of the event details, click View Printable Details at the bottom of the window. The printable report is displayed in a new window, as shown in Figure 4-13.
Table 7 EMS, WBEM and Evweb events severity values (continued) EMS severity WBEM severity Evweb severity 4 Serious 6 Critical 7 Critical 5 Critical 7 Fatal/Non-recoverable 7 Critical NOTE: • Perceived severities in Syslog is same as WBEM severities. • The WBEM severities are standard. Their number can be seen as the severity value for the actual events recorded in /var/opt/sfm/log/event.log. The Evweb severity numbering matches the HP SMH system status.
Table 9 compares the EMS Hardware Monitors properties with the equivalent EMS Wrapper provider / Native indication provider properties.
Table 11 Default event destinations for Online Diagnostics (continued) Default notification method Severity levels Online Diagnostics (evweb eventviewer -L) NOTE: The Severity levels in Table 10 indicate EMS severity. Table 12 Default event destinations for SysFaultMgmt Default notification method Severity levels SysFaultMgmt Textlog All textlog: /var/opt/sfm/log/event.
Table 13 (continued) Status values SUPPORTING ENTITY IN ERROR COMPLETED The sfmconfig -a -r command is used to change the state of a subsystem. When this command is not working with processor, the user should check for errors.
5 Administering indications and instances using HP SMH This chapter describes the SysFaultMgmt (System Fault Management) (SFM) administration tasks that you can perform using HP SMH on a local system.
NOTE: Starting September 2009 release, in HP SMH GUI, you can refer to “The equivalent command line” option, to view command line information about processors. For more information, view cprop manpage. See "man cprop" 1. Select Show All under System on the HP SMH home page. The system page is displayed. Figure 16 System Management Homepage 2. Select Processors under System on the HP SMH home page. Information about the processors is displayed. 3. To return to the HP SMH home page, click on Home.
Viewing information about System Summary To obtain information about system summary, such as the model, role, UUID, UUID (Logical), Serial number, Serial number (Logical) and many more, complete the following steps: 1. Select System Summary under System on the HP SMH home page. System summary information is displayed. 2. To return to the HP SMH home page, click on Home.
Viewing information about Management Processor To obtain information about the Management Processor (MP), such as its IP address, status, and URL, complete the following steps: 1. Select Management Processor under System on the HP SMH home page. Information about the management processor is displayed. 2. To return to the HP SMH home page, click on Home. Viewing information about Mem Error To obtain information about the memory error, complete the following steps: 1.
Viewing Partition information To obtain the Partition Information, such as the Partition Name, Type, and ID, complete the following steps: 1. Select Partition Information under System on the HP SMH home page. Information about the Partition Information is displayed. 2. To return to the HP SMH home page, click on Home. Viewing information about Blade To obtain information about the Blade, such as the Onboard Administrator and HashID, complete the following steps: 1.
1. Select Processors under System on the HP SMH home page. Information about the Processors is displayed. 2. 3. 4. Select Health Test tab on the Processors page to run a configured Health Test. Select the option Basic Health Test to run basic test configured in the system. Click Run to execute the CPU Health Test. The CPU Health Test results are displayed in the View Health Test Results pane. NOTE: 5. CPU Health Test Results can also be viewed from the command line interface (CLI).
For information on how to configure user groups in HP SMH, see the HP System Management Homepage User’s Guide at http://www.hp.com/go/smh-docs EVWEB supports new IO & Storage native indication providers to display additional info for the following providers: HPUXSASNativeIndicationProviderModule HPUXRAIDSANativeIndicationProviderModule HPUXFCNativeIndicationProviderModule HPUXStorageNativeProviderModule These native indication provider support is available on the HP Integrity Servers.
33). You cannot use the evweb list, evweb subscribe, or the evweb eventviewer command to create and delete Admin Defined event subscriptions. • Event subscriptions created using the HP SMH GUI (Event subscription administration) – You can create these event subscriptions using the GUI or the CLI. You can modify and delete the event subscriptions that are created using Event subscription administration.
• (-i ) • (-v ) • (-o ) • (-t [archive|email][handler_properties] • (-s ) • -h For more information on creating event subscriptions using CLI, see evweb_subscribe(1). Copying and creating a new event subscription using the GUI You can reuse the existing subscriptions to create another subscription. To create an event subscription by copying an existing event subscription, complete the following steps: 1.
You can modify an event subscription in the following ways: • Modify a single event subscription. You can modify a single event subscription using the modify feature by selecting the event subscription from the event subscription table. • Modify similar criteria in multiple event subscriptions. You can modify similar criteria in multiple event subscriptions by using the Copy and modify subscription feature.
If you specify only the subscription criteria and not the destination, then: • If you do not specify the -r option and the location, the current location is removed and the subscription criteria are updated. • If you specify the -r option but not the location, the current location is retained and only the subscription criteria are updated.
6. Select Modify in the Copy and modify subscription page. Evweb modifies the event subscriptions and displays a confirmation message. 7. Click OK on the confirmation message window. NOTE: The Copy and modify subscription feature is available only on the GUI. IMPORTANT: The subscription criteria are not copied when you copy an HP Advised event subscription. Therefore, ensure that you specify the subscription criteria in the Copy and modify subscription page.
-f is a switch used to force the command. This switch can be used only with the -D option. If the -f switch is not used, Evweb prompts for a confirmation before deleting an event subscription. A message stating that the execution of the evweb subscribe command was successful is displayed on the screen. NOTE: Using the CLI, you can delete only one event subscription at a time. For more information on deleting event subscriptions using the CLI, see evweb_subscribe(1).
Viewing Evweb event subscriptions You can view summary and detailed information about event subscriptions using Evweb. Viewing a summary of an Evweb event subscription using the GUI To view a summary of the event subscriptions, repeat steps 1-5 from “Launching Evweb for administration” (page 54). The Event subscription administration page is displayed. The Event subscription administration page displays a summary of the the event subscriptions, in a tabular format.
For information on viewing the summary of Evweb event subscriptions using the CLI, see evweb_subscribe(1). NOTE: Delete the subscriptions created by evweb manually. These subscriptions exists and can still be viewed while they are deleted or updated by tools and interfaces like cimsub apart from evweb. Viewing details of an event subscription using the GUI To view details of an event subscription, complete the following steps: 1. Repeat steps 1-5 from “Launching Evweb for administration” (page 54).
Viewing external event subscriptions Event subscriptions created by tools and interfaces other than Evweb are called external event subscriptions. This section describes how to view external event subscriptions using Evweb. Viewing an external event subscription using the GUI To view an external event subscription, complete the following steps: 1. Repeat steps 1-5 from “Launching Evweb for administration” (page 54). The Event subscription administration page displays the event subscription table. 2.
Viewing indications using Evweb This section describes how to perform non-administration tasks related to viewing WBEM indications using Evweb.
5. Select Event viewer in Evweb. The Event viewer page is displayed. You can view and delete WBEM indications using the Event viewer. Searching for the subscribed WBEM events Evweb enables you to search the Event archive for subscribed WBEM events. The Evweb GUI provides a link, EMT Search, using which you can obtain error, cause, and recommended solutions for errors that may be generated on an HP-UX 11i v3 system.
• -o() -c() • -r[is|be|en|co][:]() • -s[asc|desc] () • -t[eq|le|ge|bw] ()[,] • -v • -x For information on searching the WBEM events using the CLI, see evweb_eventviewer(1). Viewing summary information about WBEM events You can view summary information about events stored in the Event Archive database.
Where: -E is an option used to view details of a WBEM event. -n is a switch used specify the event archive number of the WBEM event. The screen displays detailed information about the WBEM events. For information on viewing detailed information of WBEM events using the CLI, see evweb_eventviewer(1). Deleting WBEM Events from the Event Archive You can delete a single event or multiple events at a time. Deleting an Event using GUI To delete an event, complete the following steps: 1.
This section discusses the following topics: • “Overview” (page 68) • “Searching Low Level Logs using Simple Search” (page 69) • “Searching Low Level Logs using Advanced Search” (page 69) • “Viewing List of Low Level Logs” (page 70) • “Viewing Details of Low Level Logs” (page 71) Overview The low level log is required to view information about hardware details and system errors. The Log Viewer enables you to view low level log information from the log database on a local HP-UX system.
NOTE: • Only diagnostics databases and corresponding tables are exposed to the end user. Clean: Clean option deletes contents of the specified database. It is initiated by the administrator. The administrator must execute the sfmDBUtil command with argument clean and the valid database name. /opt/sfm/bin/sfmDBUtil clean Searching Low Level Logs using Simple Search To search the log database for low level logs using Log Viewer, complete the following steps: 1.
You can also use the following switches with the -L option: • -i • -n • -j • -x • -y • -a age_number[:][yy|mm|dd] • -t [eq|le|ge|bw][:][,mm:dd:yyyy] NOTE: The -a and the -t switches are mutually exclusive and can be used with the -L option only. • -s [LogId|LogIndex|DeviceId|DeviceType|TimeOfOccurence] • -o -c NOTE: The -s, -o,and the -c switches can be used with the -L option only.
• -t [eq|le|ge|bw][:][,mm:dd:yyyy] NOTE: The -a and the -t switches are mutually exclusive and can be used with the -L option only. • -s [LogId|LogIndex|DeviceId|DeviceType|TimeOfOccurence] • -o -c NOTE: The -s, -o,and the -c switches can be used with the -L option only.
Low Level Log Details ===================== Log Id : 40 Log Index : 0 Log Type : Server Device Id : 0 Device Type : Memory Time of occurence : Thu Dec 10 2009 19:38:25 Buffer 0000000 0 2bc 0 0 4b21 0000010 509 0 0 0 500 0000020 2538 300 1112 920 0 0000030 0 0 0 0 f7fa 0000040 bca7 80 c73c 8881 500 0000050 4000 0 0 0 0 0000060 0 0 0 0 0 beb1 200 0 29e4 0 0 0 0 300d 0 b73c 80d 0 0 d30 0 0 d411 0 0 0 For information on viewing details of low level logs using the CLI, see evweb_logviewer(1).
Table 17 Entries in sfm.log (continued) Field Description Thread ID Displays the thread ID. Message Displays the text message. To change the default location of the sfm.log file, you must configure the /var/opt/sfm/conf/FMLoggerConfig.xml file. You can enable, modify, and disable tracing for an Evweb session. A session is the duration between a login and a logout. At the end of a session, tracing is automatically disabled. In an active session, the trace level remains valid until you modify it.
2. 3. Enter your user name and password in the appropriate text boxes. Click Sign In on the login screen. The HP SMH home page is displayed. 4. Do one of the following: • Select Tools -> Subscription Administration. or • Select Logs -> Event Viewer. NOTE: The Enable Tracing option is not displayed if tracing is already enabled. Instead, the Disable Tracing and the Modify Tracing options are displayed. 5. Select Enable Tracing available at the top right corner of the page.
7. Select Modify Tracing. The tracing level is modified and a confirmation message is displayed. 8. Click OK on the confirmation message window. For more information about modifying tracing using the HP SMH GUI, select Help on the action pane of either the Event Viewer or the Event Subscription Administration page.
• “Querying the CER using Simple Search” (page 77) • “Querying CER using Advanced Search” (page 77) • “Viewing an Event from CER” (page 78) EMT Overview The SysFaultMgmt (System Fault Management) (SFM) includes a user component called EMT, which enables you to view the error messages that are generated on an HP-UX 11i v3 system. The EMT includes Common Error Repository (CER), which is an online, searchable, and updateable error repository. The CER contains error metadata.
Querying the CER using Simple Search To query the CER using the Simple Search feature, you can use either the HP SMH GUI or the CLI. EMT enables you to query the CER for system-specific events. This feature reduces the query time, and is available in both GUI and CLI modes Querying CER for Events using the GUI To query the CER for events using the HP SMH GUI, complete the following steps: 1. Repeat steps 1-5 from “Launching EMT” (page 76). 2.
For more information about querying the CER using the Advanced Search feature on the HP SMH GUI, select Help on the action pane of the Advanced Search page. Viewing an Event from CER You can view the summary of events and detailed information about an event present in CER. The List Events page displays the search results in a tabular format. In this document, this table is referred to as the Error Summary Table.
-v is an option used to view detailed information about an event from the CER. For more information on viewing details of an event using the CLI, see emtui(1). Administering Events in CER This section describes how to administer events using EMT.
You can also use the following switches with the -a option: • -c • -i For information about adding a custom solution using the CLI, see emtui(1). Modifying a Custom Solution You can use either the HP SMH GUI or the CLI to modify a custom solution in CER. Modifying a Custom Solution using the GUI To modify a custom solution using the HP SMH GUI, complete the following steps: 1. Repeat steps 1-5 from “Launching EMT” (page 76). 2.
3. Click Delete Selected Solution on the Detailed Error Information (Administrative View) pane. The Delete a Custom Solution page is displayed. This page displays the custom solution and the error metadata. 4. Click Delete Selected Solution on the Delete a Custom Solution page. A confirmation message is displayed. 5. Click OK on the message box. The custom solution is permanently removed from the CER.
Table 19 Entries in error_log Field Description Date Displays the date when the message was logged in the error_log file. Time Displays the time when the message was logged in the error_log file. Trace level Displays the severity of the error. IP address Displays the IP address of the client system. Message Displays messages that are generated on the client system. Address Displays the program that has generated the log.
5. Click OK on the confirmation message window. For more information about modifying tracing using the HP SMH GUI, select Help on the action pane of the Modify Tracing page. Modifying Tracing using the EMT CLI To modify tracing using the EMT CLI, enter the following command at the HP-UX prompt: # export EMT_TRACE_LEVEL= Tracing is now modified. The new trace value is the trace level that you want to set.
6 Troubleshooting SysFaultMgmt (System Fault Management) (SFM) This chapter describes how to troubleshoot SysFaultMgmt (System Fault Management) (SFM) providers and EVWEB. This chapter addresses the following topics: • “Troubleshooting instance providers” (page 84) • “Troubleshooting indication providers” (page 89) • “Troubleshooting EVWEB” (page 94) For information on Upgrade Installation of the Postgres 8.4.8, see the Installation scenarios of Postgres 8.4.8 at www.hp.
Table 20 Troubleshooting instance providers (continued) Problem Cause Solution 5. After the CIMOM restarts, follow the process from the step 1 mentioned above. 6. After the provider module is registered, create a link between the SysFaultMgmt (System Fault Management) (SFM) providers and the CIMOM by entering the following command at the HP-UX prompt: On Itanium-based systems, enter: # ln -s /opt/sfm/lib/libsfmproviders.1\ /opt/wbem/providers/lib/libsfmproviders.
Table 20 Troubleshooting instance providers (continued) Problem Cause Solution 1. Enter the following command at the HP-UX prompt to disable SFMProviderModule: # cimprovider –d –m SFMProviderModule 2. Enter the following command at the HP-UX prompt to enable SFMProviderModule: # cimprovider –e –m SFMProviderModule Alternatively, you can enter the following command at the HP-UX prompt to start SFMProviderModule: # sh /opt/sfm/bin/restart_sfm.sh The logs to /var/opt/sfm/log/state.
Table 22 Troubleshooting instance providers (continued) Problem: Requests for instances do not return any value. Causes Solution To restart the CIMOM, enter the following command at the HP-UX prompt: # cimserver Cause 2 The provider is not registered properly. To register the provider, complete the following steps: 1. Enter the following command at the HP-UX prompt: # cimprovider -ls | grep SFMProviderModule 2.
Table 22 Troubleshooting instance providers (continued) Problem: Requests for instances do not return any value. Causes Solution Following is a sample output of the command: MODULE OperatingSystemModule ComputerSystemModule ProcessModule IPProviderModule SFMProviderModule STATUS OK OK OK OK Degraded If the status of SFMProviderModule is Degraded as displayed in the given output, SFMProviderModule is not running. To enable SFMProviderModule, complete the following steps: 1.
Table 24 Troubleshooting instance providers (continued) Problem: Indications fulfilling the conditions defined in the HP-Known HP-Defined filters, are not logged in the Event Archive.
Table 26 Troubleshooting indication providers (continued) Problem: Indications corresponding to events generated by the Event Monitoring Service (EMS) monitors, are not logged in the Events List. Causes Solution ProcessModule IPProviderModule SFMProviderModule OK OK Degraded If the status displayed is not OK, the provider module is not registered properly. To register the provider module, enter the following command at the HP-UX prompt: # cimmof -nroot/PG_InterOp /opt/sfm/schemas/mof/SFMProvidersR.
Table 26 Troubleshooting indication providers (continued) Problem: Indications corresponding to events generated by the Event Monitoring Service (EMS) monitors, are not logged in the Events List.
Table 26 Troubleshooting indication providers (continued) Problem: Indications corresponding to events generated by the Event Monitoring Service (EMS) monitors, are not logged in the Events List. Causes Solution Cause 4 Create the following enumerateInstances_sub.xml file and save it in any location: Subscriptions do not exist. PAGE 93Table 26 Troubleshooting indication providers (continued) Problem: Indications corresponding to events generated by the Event Monitoring Service (EMS) monitors, are not logged in the Events List. Causes Solution CIM_ComputerSystem hpdst348 Cause 5 The indication providers are not loaded properly.
Table 26 Troubleshooting indication providers (continued) Problem: Indications corresponding to events generated by the Event Monitoring Service (EMS) monitors, are not logged in the Events List.
Table 27 Troubleshooting EVWEB (continued) Problem Cause following errors are displayed: Solution in the Event Archive. The second message Could not fetch the indicates that the EVWEB is unable to details of the establish a connection events. with the Event Archive. The connection to The Event Archive the database could Database service is not not be established. running properly. If the output of this command is sfmdb, the Event Archive Database service is running properly.
Table 27 Troubleshooting EVWEB (continued) Problem Cause WBEM Indications are not SFMProviderModule is mailed to your email not running. address.
Table 27 Troubleshooting EVWEB (continued) Problem Cause Solution indicate a problem with the installation Both EMS and SysFaultMgmt (System Fault Management) (SFM) log the same symptom in the syslog. The syslog functionality is available from SysFaultMgmt (System Fault Management) (SFM) Version C.06.00.07.01, September 2009 release, to provide a summary of event information of critical and serious events. The default subscription to syslog HP_defaultSyslog is configured.
A EMT Message Definition Following is a sample EMT Message file: $ Descriptor Header begins $ <> DescriptorID=0000023100000010800000AA006D2EA3 $ <> ProductName = myProduct $ <> ProductID = ID $ <> ProductEmailAlias=myproduct@abc.com $ <> OrgName = myorg $ <> OrgType = ISV $ <> Subsystem={(Type=EMS, Name= dm_chassis),(Type=WBEM, Name=FileSystemProvider)} $ <> ProductCategory=Kernel $ <> MsgCat={ID=1,(Path=./ lvmcommonmessages.cat, Locale= ja_JP.
Table 28 EMT Message File Description (continued) Tag Description Usage ProductCategory Specify one or more of the following product ProductCategory= categories that best describes your product: Kernel,IO,Network • Hardware • Network • IO • Kernel • Commands • Others MsgCat Specify a list of message catalogs. The MsgCat tag has the following attribute: ID – A unique number used to identify an error message. MsgCat={(ID=1, Path=../../../bin/cat/en_US.iso88591/module1.cat,LocaleName= en_US.
Table 28 EMT Message File Description (continued) Tag Description Usage only one cause and one or more corrective action for a given error message, the Action tags are associated with the Cause tag. In such a situation, the Cause_Action tag is not mandatory. For any error, a cause can be specified without specifying the corrective action. However, a corrective action cannot be specified without specifying a cause. WBEMDetail Specify WBEM specific details of a message.
B Interpretation of HP SMH instances This appendix describes the fields and enables you to interpret the instances in the HP SMH property pages.
Processor instances This section describes the processor instances. Figure 20 Sample Processors property page Table 29 (page 102) describes the fields and enables you to interpret the values displayed in Figure 20 (page 102). Table 29 Description of the Processors Fields and Values Fields and Values Description Status Indicates the status of the processors. An OK status indicates that all the processors are functioning properly. Click Events to see the details of the errors.
Memory instances This section describes the memory instances. Figure 21 Sample Memory property page Table 30 (page 103) and Table 31 (page 104) describes the fields and enables you to interpret the values displayed in Figure 21 (page 103). Table 30 Description of the Memory Slots Fields and Values Fields and Values Description Status Indicates the status of the memory module. An OK status indicates that all the modules are configured properly.
Table 30 Description of the Memory Slots Fields and Values (continued) Fields and Values Description Part Number Indicates the part number of the memory. HashID Identifies an instance of the device. Table 31 Description of the Empty Slots Fields and Values Fields and Values Description Location Indicates the location of the memory. Attributes such as Cabinet Number, Cell Slot, and DIMM Slot help narrow down the location of the memory module.
Table 32 Description of the Memory Slots Fields and Values (continued) Fields and Values Description Logical memory information Physical memory information Device Bay Information NOTE: Indicates the URL to launch the blade information page on the OA. Memory information displayed is as viewed from a hard partition (nPar).
System Summary instances This section describes the system summary instances. Figure 23 Sample System Summary property page Table 33 (page 106), Table 34 (page 107) and Table 35 (page 107) describes the fields and enables you to interpret the values displayed in Figure 23 (page 106). Table 33 Description of the General Information Fields and Values Fields and Values Description Model Describes the system model.
Table 33 Description of the General Information Fields and Values (continued) Fields and Values Description UUID UUID (Logical) Universally Unique ID (UUID) indicates the asset number of the system. Indicates the UUID of the logical server. A logical server is a software configuration that can be applied to a server blade or a virtual machine. Also, you can move a logical server from one server blade or a virtual machine to another.
Cooling Device instances This section describes the cooling device instances. Figure 24 Sample Cooling device property page Table 36 (page 108) describes the fields and enables you to interpret the values displayed in Figure 24 (page 108). Table 36 Description of the Cooling Device Fields and Values Fields and Values Description Status Indicates the status of the fans. An OK status indicates that all the modules are configured properly.
Power supply instances This section describes the power supply instances. Figure 25 Sample Power property page Table 37 (page 109) describes the fields and enables you to interpret the values displayed in Figure 25 (page 109). Table 37 Description of the Power Supply Fields and Values Fields and Values Description Status Indicates the status of the power supply. An OK status indicates that the power supplies are configured properly.
Temperature instances This section describes the temperature instances. Figure 26 Sample Temperature property page Table 38 (page 110) describes the fields and enables you to interpret the values displayed in Figure 26 (page 110). Table 38 Description of the Temperature Fields and Values 110 Fields and Values Description Status Indicates whether the sensor temperature in the system is normal or not. However, the status of the sensor temperature does not reflect the status of the cooling devices.
Voltage instances This section describes the voltage instances. Figure 27 Sample Voltage property page Table 39 (page 111) describes the fields and enables you to interpret the values displayed in Figure 27 (page 111). Table 39 Description of the Voltage Fields and Values Fields and Values Description Status Indicates whether the sensor voltage in the system is normal or not. An OK status indicates that the sensor voltage in the system is normal. HashID Identifies an instance of the device.
FRU Information instances This section describes the FRU Information instances. Figure 28 Sample FRU Information property page Table 40 (page 112) describes the fields and enables you to interpret the values displayed in Figure 28 (page 112). Table 40 Description of the MP Fields and Values 112 Fields and Values Description Name Indicates the FRU Name of the Physical Element. Serial Number Indicates the serial number of the FRU. HashID Identifies an instance of the device.
Management Processor instances This section describes the Management Processor (MP) instances. Figure 29 Sample MP property page Table 41 (page 113) describes the fields and enables you to interpret the values displayed in Figure 29 (page 113). Table 41 Description of the MP Fields and Values Fields and Values Description Status Indicates whether the Management Processor (MP) is functioning properly or not. An OK status indicates that the MP is functioning properly.
Memory Error instances This section describes the Mem Error instances. The Mem Error property page displays PDT information in the Legacy server but PET information in the NGIS server. Figure 30 Sample PDT Memory Error property page Table 42 (page 114) describes the fields and enables you to interpret the values displayed in Figure 30 (page 114). Table 42 Description of the Memory Error PDT Fields and Values Fields and Values Description HashID Identifies an instance of the device.
NOTE: There are some special cases in PDT memory error when using the cprop command by CLI or navigating to “SMH > System > Mem Error” property page: Case 1 # cprop -summary -c "Mem Error" [Component]: Mem Error This case indicates that there is no PDT memory error in this server at all.
Table 43 Description of the Memory Error PET Fields and Values (continued) Fields and Values Description Device Indicates in which device the error is found. Width Indicates the width of the device. Error Count Error count occurred in each DRAM. Error State Indicates the state of the error. Error DCK State Indicates the state of DCK error. Rank Indicates the rank of the error. Rank Size Indicates the entries of the memory rank sizes.
Firmware Information instances This section describes the Firmware Information instances. Figure 32 Sample Firmware Information property page Table 44 (page 117) describes the fields and enables you to interpret the values displayed in Figure 32 (page 117). Table 44 Description of the Firmware Information Fields and Values Fields and Values Description Name Indicates the name of the entity, such as the system firmware, MP, or the system backplane cell, whose firmware information is displayed.
Enclosure Information instances This section describes the Enclosure instances. Figure 33 Sample Enclosure property page Table 45 (page 118) describes the fields and enables you to interpret the values displayed in Figure 33 (page 118). Table 45 Description of the Enclosure Information Fields and Values 118 Fields and Values Description Status Indicates the status of the enclosure. An OK status indicates that the components of the enclosure are functioning properly.
Complex-wide Info instances This section describes the Complex-wide Info instances. Figure 34 Sample Complex-wide Info property page Table 46 (page 120), Table 47 (page 120) and Table 48 (page 120) describes the fields and enables you to interpret the values displayed in Figure 34 (page 119).
Table 46 Description of the Complex Information Fields and Values Fields and Values Description Complex Name Describes user defined name for the complex. Model Defines Model identification string. Serial Number Indicates the serial number of the complex as assigned by the original manufacturer. Revision Displays string for the revision number of the profile, consisting of the major and minor revision numbers concatenated with a period as a separator.
Cell Board instances This section describes the Cell Board instances. Figure 35 Sample Cell Board property page Table 49 (page 121) describes the fields and enables you to interpret the values displayed in Figure 35 (page 121). Table 49 Description of the Cabinet Fields and Values Fields and Values Description Firmware Version Displays string for the firmware revision number, consisting of the major number separated from the minor number by a period. Status Indicates the status of the component.
Table 49 Description of the Cabinet Fields and Values (continued) Fields and Values Description Total Processor Slots Indicates the number of processor module slots on the cell. Total Empty Processor Slots Indicates the number of all empty processor slots. Processors Per Module Indicates the number of processors per processor module on the cell. Total Installed Processor Modules Indicates the number of all installed processor modules in the cell.
Partition Information instances This section describes the Partition Information instances. Figure 36 Sample Partition Information property page Table 50 (page 123) describes the fields and enables you to interpret the values displayed in Figure 36 (page 123). Table 50 Description of the Partition Fields and Values Fields and Values Description Partition Name Describes user defined name with the numeric label for the Partition. nPartition ID Indicates the ID of the nPartition in the complex.
Table 50 Description of the Partition Fields and Values (continued) 124 Fields and Values Description Total Deconfigured Processor Modules Indicates the number of all deconfigured processor modules in the partition. Total Installed Memory Displays the total amount of memory installed in the partition, in megabytes. Total Installed Cells Indicates the number of all cells installed in the partition. Total Active Cells Indicates the number of all active cells in the partition.
Blade instances This section describes the Blade instances. Figure 37 Sample Blade property page Table 51 (page 125) describes the fields and enables you to interpret the values displayed in Figure 37 (page 125). Table 51 Description of the Blade Fields and Values Fields and Values Description Status Indicates the status of the blade. Hardware Path Indicates the hardware path of the blade. Serial Number Indicates the serial number of the blade.
Cell Blade instances This section describes the Cell Blade instances. Figure 38 Sample Cell Blade property page Table 52 (page 126) describes the fields and enables you to interpret the values displayed in Figure 38 (page 126). Table 52 Description of the Cell Blade Fields and Values 126 Fields and Values Description Status Indicates the status of the blade. Hardware Path Indicates the hardware path of the blade.
Launch the Onboard Administrator To access the Onboard Administrator (OA) from the property pages, complete the following steps: 1. Click on the Onboard Administrator link from the property page. Figure 39 Onboard Administrator 2. The OA login page opens in a new browser window. Figure 40 OA login page 3. Enter the Onboard Administrator User name and Password.
C Syslog property order This appendix describes the order for the properties (IndicationIdentifier, EventID, PerceivedSeverity, ProviderName and Summary) in the event message which is written in syslog by the HP_defaultSyslog subscription. NOTE: The term legacy refers to HP Integrity Servers with Intel(R) Itanium(R) processors older than 9300. The term HP Integrity Servers refers to Intel(R) Itanium(R) 9300 processors.
D SysFaultMgmt (System Fault Management) (SFM) configuration files This appendix describes the items of different configuration files in SysFaultMgmt (System Fault Management) (SFM). The user can configure only the following three files: • “DBConfig.xml” (page 129) • “FMLoggerConfig.xml” (page 129) • “evweb.conf” (page 130) DBConfig.xml The DBConfig.
Table 57 FMLoggerConfig.xml file configuration parameters (continued) Parameter Default value Range value FileSize 20480 2KB to 1048576 KB (1 GB) NBackupFiles 3 1 to 10 evweb.conf The evweb.conf is a configuration file used to set parameters used by the email consumer. SysFaultMgmt (System Fault Management) (SFM) allows the evweb.
Glossary A-B Admin-defined event subscription Subscriptions created by the administrator using the CLI. These subscriptions cannot be deleted. Admin-defined filters Filters that can be created, deleted, and modified to set the criteria for indications that must be logged. C Central Management Server (CMS) The server monitoring the client systems in the network using SysFaultMgmt (System Fault Management) (SFM).
External subscriptions These are subscriptions created by tools other than EVWEB. H HP System Management Homepage (HP SMH) HP's management application installed on the local system that uses WBEM instrumentation on operating systems such as HP-UX, Linux, and Windows. HP Systems Insight Manager (HP SIM) HP's management application installed on the CMS that uses WBEM instrumentation on operating systems such as HP-UX, Linux, and Windows.
S sfmdb The output of a command that indicates that Event Archive Database service is running properly. subscription Configuring SysFaultMgmt (System Fault Management) (SFM) for consumers to receive indications. For example, HP SIM could subscribe to indications generating on hardware devices on a system. SysFaultMgmt The name of the bundle that includes the SysFaultMgmt (System Fault Management) (SFM) software. T-V Tracing Tracing is an error-logging and reporting facility provided by EVWEB and EMT.
Index Central Management Server see CMS CER, 76 CIMOM, 18 cimserver, 84, 87 -s option, 84, 86 cimserver -s, 84, 87 CMS, 17 command-line interface, 21 Common Information Model Object Manager see CIMOM configuration monitor mode, 34 SFM, 22 cooling devices on a system, 50 creation subscription, 36 custom solution adding, 79 deleting, 80 modifying, 80 Enforce dependency, 22 error metadata, 76 Event Archive, 33, 95 HP-Known HP-Defined filter, 89 troubleshooting, 94, 95, 96 event list, 41 Event Monitoring Serv
Memory, 10, 84 IPMI Event Viewer slview, 10 J jobid, 27 L Log Viewer, 68 Archive Log Database, 68 Current Log Database, 68 Logfile, 26, 27 logs /var/opt/sfm/log/sfm.log file, 72, 81 /var/sam/log/samlog.log file, 73 M swremove command, 28 SysFaultMgmt, 24, 31 System Fault Management see SFM System Page of HP SIM, 47 T temperature status, 50 terminal user interface, 21 tracing, 72, 81 troubleshooting, 95 EMS Wrapper Provider, 92, 93 Event Archive, 94, 96 module, 90 V O /var/sam/log/samlog.
7 Support and other resources About this document This document describes how to install, administer, and troubleshoot the SysFaultMgmt (System Fault Management) (SFM) software and its components. Document updates may be issued between editions to correct errors or to document product changes. To ensure that you receive the updated or new editions, subscribe to the appropriate product support service. Contact your local HP sales representative for more information.
Chapter 3 Configuring indication providers Instructs how to configure the indication filters and error logging. Chapter 4 Administering Indications using HP SIM Describes how to use the HP Systems Insight Manager (HP SIM) GUI to administer indications on remote systems. Chapter 5 Administering Indications and instances using HP SMH Describes how to use the HP System Management Homepage (HP SMH) GUI to administer indications and view instances on the local system.
Table 60 HP-UX Releases Release identifier Release name Supported processor architecture B.11.31 HP-UX 11i v3.0 Intel® Itanium®, PA-RISC New and changed information in this edition • The Table 4 (page 15) lists the instance and indication providers support on different platforms.
8 Documentation feedback HP is committed to providing documentation that meets your needs. To help us improve the documentation, send any errors, suggestions, or comments to Documentation Feedback (docsfeedback@hp.com). Include the document title and part number, version number, or the URL when submitting your feedback.