HP-UX SysFaultMgmt (System Fault Management) (SFM) Administrator Guide HP-UX 11i v3 HP Part Number: 762798-001 Published: March 2014 Edition: 1
Legal Notices Copyright 2003, 2014 Hewlett-Packard Development Company, L.P. Confidential computer software. Valid license from HP required for possession, use or copying. Consistent with FAR 12.211 and 12.212, Commercial Computer Software, Computer Software Documentation, and Technical Data for Commercial Items are licensed to the U.S. Government under vendor’s standard commercial license. The information contained herein is subject to change without notice.
Contents HP secure development lifecycle......................................................................8 1 Introduction...............................................................................................9 Overview................................................................................................................................9 Features and benefits..............................................................................................................
Error log processing on a 6.x (vPar/VM) Guest.................................................................50 HP-UX Virtual Partitions (vPars) (referred as Legacy vPars).........................................................51 Integrity Virtual Machine (VM) 4.x (referred as HPVM)............................................................51 Inventory handling........................................................................................................51 Indication handling....................
Filtering WBEM events using the GUI...............................................................................70 Searching for the subscribed WBEM events using the GUI..................................................70 Searching for the subscribed WBEM events using the CLI...................................................70 Viewing summary information about WBEM events................................................................71 Viewing summary information using GUI...............................
Modifying Tracing using the EMT GUI..................................................................................88 Modifying Tracing using the EMT CLI....................................................................................88 Disabling Tracing using the EMT GUI...................................................................................88 Disabling Tracing using the EMT CLI.....................................................................................
9 Documentation feedback.........................................................................
HP secure development lifecycle Starting with HP-UX 11i v3 March 2013 update release, HP secure development lifecycle provides the ability to authenticate HP-UX software. Software delivered through this release has been digitally signed using HP's private key. You can now verify the authenticity of the software, before installing the products, delivered through this release. To verify the software signatures in signed depot, the following products must be installed on your system: • B.11.31.
1 Introduction This document is about administration and the most recent product information on HP-UX WBEM SysFaultMgmt, also known as System Fault Management or SFM, which is supported on HP-UX 11i v3 operating systems. Table 1 (page 9) lists the product version for which the document is applicable. Table 1 Documentation Support for SysFaultMgmt (System Fault Management) (SFM) Operating system Version HP-UX 11i v3 C.07.12.06.
You must be familiar with WBEM technology before reading this guide. For more information on WBEM technology, see the HP WBEM Services for HP-UX and Linux System Administrator's Guide and HP WBEM Services Release Notes at: http://www.hp.com/go/hpux-networking-docs. Features and benefits SysFaultMgmt (System Fault Management) (SFM) dynamically queries property information about a hardware device on a local system.
Components of SysFaultMgmt (System Fault Management) (SFM) This section discusses the following topics: • EVWEB • Error Management Technology (EMT) • CIMUtil • IPMI Event Viewer • providers EVWEB EVWEB is a component of SysFaultMgmt (System Fault Management) (SFM) that enables you to administer and view WBEM indications generated on the local system on which SysFaultMgmt (System Fault Management) (SFM) is installed. For more information on EVWEB, see “Evweb overview” (page 58).
Table 2 Instance providers (continued) Instance provider Description • Blade Serial number • Blade Part number • Blade Status NOTE: The Blade instance provider is available on HP Integrity BL860c i2/BL870c i2/BL890c i2 Server Blades, HP Integrity Superdome 2, HP Integrity BL860c i4, BL870c i4, BL890c i4, rx2800 i4 and rx2900 i4.
Table 2 Instance providers (continued) Instance provider Description Firmware Revision provider: Firmware Revision provider retrieves the following types of information: FirmwareRevisionProvider • System firmware revision • Management Processor (MP) firmware revision Management Processor provider: MPProvider Management Processor provider retrieves information about the management processor on the system.
Table 2 Instance providers (continued) Instance provider Description Consolidated Status provider: Consolidated Status provider provides the overall health status of various subsystems of the managed node. The overall health status is consolidated from the health status of individual status providers registered with WBEM.
Table 3 Indication providers (continued) Indication provider Description The following EMS Hardware Monitors are supported on HP Integrity® servers running the HP-UX 11i v3 operating system: • Corrected Platform Error Monitor (cpe_em) • IPMI Forward Progress Log Monitor (fpl_em) • CMC Monitor (cmc_em) • Itanium Core Hardware Monitor(ia64_corehw) • Itanium Memory Monitor (memory_ia64) NOTE: This provider and WBEM to EMS Consumer is not supported on HP Integrity BL860c i2, BL870c i2 & BL890c i2 Server Blades
Table 3 Indication providers (continued) Indication provider Description 1. Generates WBEM indications equivalent to the events that the monitors it replaces generate. 2. Reports these WBEM indications to the CIMOM. In the WBEM indication details, the provider name displayed corresponds with the device to which the indication is related. For example, if the name of the provider displayed in the event details is MemoryIndicationProviderIA, the event is related to memory.
Table 4 Instance/Indication providers support (continued) Instance/ Indication providers PA-RISC provider IA legacy provider1 IA NGIS providers2 i2, BL890c i2, BL860c i4, BL870c i4, and BL890c i4 EnvironmentalInstanceProvider and √ √ √ FirmwareRevisionProvider √ √ √ MemoryProvider and √ √ FMDProvider MemoryStatusProvider √ Not supported on HP Superdome 2 Supported only on HP Integrity BL860c i2, BL870c i2, BL890c i2, BL860c i4, BL870c i4, BL890c i4, rx2800 i2, rx2800 i4 and rx2900 i4 Enclo
Table 5 Mapping provider module and provider Provider Module Provider registered with CIMOM StateChangeIndicationProvider EvmCimProvider Provider name in Events StateChangeIndicationProvider EvmCimProvider SEL02_IndicationProvider FPL_IndicationProvider CMC_IndicationProviderIA CPUIndicationProvider MemoryIndicationProviderIA SFMProviderModule MemoryIndicationProvider SFMIndicationProvider CPE_IndicationProviderIA PCIeIndicationProvider MCAIndicationProvider LPMC_IndicationProviderPA ChassisIndicationPro
HP SIM (Systems Insight Manager) HP SIM is a WBEM based user interface for controlling and monitoring resources within a large-scale system. You can use HP SIM to create subscriptions and to view indications and instances on a remote system. You must install HP SIM on the CMS. You can use HP SIM to launch HP SMH. HP SMH (System Management Homepage) HP SMH is a secure, Web-based management application.
3. 4. The provider converts these events into WBEM indications and reports these indications to the CIMOM. CIMOM directs these indications to the CMS that has created subscriptions for indications. EVWEB retrieves the errors that occurred on the local system and stores the indications either in the Event Archive or in your Email box, or both, depending on your configuration. You can view indications using HP SIM on the remote system and HP SMH on the local system.
2 Installing SysFaultMgmt (System Fault Management) (SFM) software This chapter discusses the following topics: • “Prerequisites” (page 21) • “Installing SysFaultMgmt (System Fault Management) (SFM) software from the media” (page 22) • “Installing SysFaultMgmt (System Fault Management) (SFM) software from the web” (page 26) • “Verifying the installation” (page 27) • “Removing SysFaultMgmt (System Fault Management) (SFM) software” (page 29) • “Verifying removal of SysFaultMgmt (System Fault Manage
• SysMgmtPlus Version A.04.00, September 2010 release or later • OnlineDiag Version B.11.31.06.xx on HP 9000 systems only, September 2009 release or later (OnlineDiag B.11.31.22.02, September 2013 release is the latest version) EMS Version A.04.20.31 STM Version D.06.00 NOTE: • The listed versions of the software are the minimum supported requirements. Subsequent versions are compatible with this version of SysFaultMgmt (System Fault Management) (SFM) unless otherwise noted.
4. 5. 6. In the Specify Source window, select the appropriate location and click OK. The SD Install Software Selection window is displayed. In the SD Install - Software Selection window, select Options-> Autoselect dependencies when marking software. Select Enforce dependency analysis errors in agent, and click OK, as shown in the following figure. The Note window is displayed. Selecting these options automatically installs all the dependencies. NOTE: The system selects some options by default.
The following figure displays the beginning of the configuration phase: When SysFaultMgmt (System Fault Management) (SFM) software installs, the Install window appears indicating that SysFaultMgmt (System Fault Management) (SFM) software is installed successfully, as shown in the following figure: 24 Installing SysFaultMgmt (System Fault Management) (SFM) software
9. Unmount the CD. To unmount, enter the following command at the HP-UX prompt: # unmount /tmp/cdrom 10. To verify whether SysFaultMgmt (System Fault Management) (SFM) software is installed properly, enter the following command at the HP-UX prompt: # swlist | grep SysFaultMgmt If SysFaultMgmt (System Fault Management) (SFM) software is installed properly, SysFaultMgmt and the version number of SysFaultMgmt (System Fault Management) (SFM) software are displayed in the output.
Installing SysFaultMgmt (System Fault Management) (SFM) software from the web SysFaultMgmt (System Fault Management) (SFM) depot is available for download on the OE media and web.
Verifying the installation This section describes how to verify SysFaultMgmt (System Fault Management) (SFM) software installation using the TUI and the CLI. Verifying the installation using the TUI To verify SysFaultMgmt (System Fault Management) (SFM) software installation, complete the following steps: 1. Log in to the system as a superuser. 2. Click Logfile in the Install window, as shown in the following figure: The Logfile, which includes details about the installation, is displayed.
3. For information about errors related to installation, enter the following command at the HP-UX prompt: # swjob -a log @ :/ The jobid is available in the Logfile, as underlined in the Logfile window, in the following figure: For example, enter the following command at the HP-UX prompt: # swjob -a log iemlhamia-0013 @ iemlhamia.india.hp.com:/ Verifying the installation using the CLI To verify your installation using the CLI, complete the following steps: 1.
3. For information about installation-related errors, enter the following command at the HP-UX prompt: # swjob -a log @ :/ For example, enter the following command at the HP-UX prompt: # swjob -a log iemlhamia-0005 @ iemlhamia.india.hp.com:/ NOTE: The logs to /var/opt/sfm/log/install.log are written when SysFaultMgmt (System Fault Management) (SFM) is getting installed. NOTE: Ignore the error Unable to connect to EVM, retrying, and subsequent messages from sfm.
4. Select Actions->Mark for Remove in the SD Remove window, as shown in the following figure: 5. Select Actions->Remove, as shown in the following figure: 6.
The following figure is a sample of the removal process in progress: 7.
8. To verify whether SysFaultMgmt (System Fault Management) (SFM) software is removed properly, enter the following command at the HP-UX prompt: # swlist | grep SysFaultMgmt If SysFaultMgmt (System Fault Management) (SFM) software is removed properly, SysFaultMgmt (System Fault Management) (SFM) and the version number of SysFaultMgmt (System Fault Management) (SFM) software does not appear in the output.
Verifying removal of SysFaultMgmt (System Fault Management) (SFM) software This section describes how to use the TUI and the CLI to verify whether SysFaultMgmt (System Fault Management) (SFM) software is removed successfully. Verifying removal using the TUI To verify whether SysFaultMgmt (System Fault Management) (SFM) software is removed successfully, complete the following steps: 1. Log in to the system as a superuser. 2. Click Logfile in the Remove Window.
3 Configuring indication providers This chapter describes the following topics: • “Configuring indication filters” (page 34) • “Configuring error logging in SysFaultMgmt (System Fault Management) (SFM)” (page 35) • “Configuring the monitoring mode” (page 35) Configuring indication filters You must configure the indication filters to view desired indications.
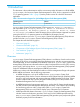
The following output is displayed: Filter Filter Filter Filter Filter Filter Filter Filter Filter Name Type Unique Identifier Query Query Language Source Namespace Description State Last Operation : : : : : : : : : AdminFilter_2 Admin Defined Filter 10002 Select * from HP_AlertIndication where (PerceivedSeverity >= 4) WQL root/cimv2 Admin Filter Enabled Filter State Add Filter HP_AlertIndication is derived from CIM_AlertIndication and HP_DeviceIndication is derived from HP_HardwareIndication.
To check whether the SFMIndicationProvider is working properly, send a memory test event by entering the following command at the HP-UX prompt: # /opt/sfm/bin/sfmconfig -t -m The following output indicates that the SFMIndicationProvider is working properly: Sending test event for memory monitor. NOTE: You can also send test events for other devices that the SFMIndicationProvider monitors. For information on the devices monitored by the SFMIndicationProvider, see Table 3 (page 14).
4 Administering indications and instances using HP SIM This chapter describes SysFaultMgmt (System Fault Management) (SFM) administration on a remote system using HP Systems Insight Manager (HP SIM). NOTE: You can perform similar tasks using other management applications that are compliant with the Common Information Model (CIM) (2.8) schema (or later) of the Distributed Management Task Force (DMTF). The terms events and indications are used interchangeably in this document.
2. To create subscriptions, select Options-->Protocol Settings-->Global Protocol Settings in the HP SIM Home page, as shown in Figure 4-1. Figure 2 HP SIM Home Page The Global Protocol Settings window is displayed, as shown in Figure 4-2. Figure 3 Global protocol settings 3. 38 In Figure 4-2, under default WBEM settings, select Enable WBEM. Click OK to save your settings.
4. Select Configure->Configure or Repair Agents, as shown in Figure 4-3. Figure 4 Configuration The Configure or Repair agents window is displayed, as shown in Figure 4-4. Figure 5 Configure or Repair Agents 5. From the Add targets by selecting from: list in Figure 3-4, select All systems to view and select the systems.
the selected system. The list of systems is displayed in the Select Target Systems window, as shown in Figure 6. Figure 6 Select Target Systems 6. To select all the systems in the network, select the Select “All Systems” itself check box, as shown in Figure 4-5. Click Apply. The Verify Target Systems window is displayed, as shown in Figure 4-6.
7. Select the appropriate check box to verify the target systems and click Next, as shown in Figure 4-6. The Enter credentials window is displayed, as shown in Figure 4-7. Figure 8 Enter credentials 8. Enter your credentials in the given fields, as shown in Figure 4-7. Click Next. The Configure or Repair settings window is displayed, as shown in Figure 4-8. Figure 9 Configure or Repair settings 9. On the Configure or Repair settings window, click Run Now.
Figure 10 Task Results 10. To obtain a printable report of the indication subscription details, click View Printable Report at the bottom of the window. The report is displayed, as shown in Figure 4-10. Figure 11 Printable Report of the indication Subscription NOTE: For more information, see HP Systems Insight Manager Installation and Configuration Guide for HP-UX at: http://www.hp.com/go/hpsim.
1. Select All Events in the left pane of the HP SIM window. The list of events is displayed, as shown in Figure 4-11. Figure 12 Events list 2. To view the details of an event, select the event. The details are displayed at the bottom of the same window, as shown in Figure 4-12.
3. To obtain the printable version of the event details, click View Printable Details at the bottom of the window. The printable report is displayed in a new window, as shown in Figure 4-13.
Table 7 EMS, WBEM, and Evweb events severity values (continued) EMS severity WBEM severity Evweb severity 4 Serious 6 Critical 7 Critical 5 Critical 7 Fatal/Non-recoverable 7 Critical NOTE: • Perceived severities in Syslog is same as WBEM severities. • The WBEM severities are standard. Their number can be seen as the severity value for the actual events recorded in /var/opt/sfm/log/event.log. The Evweb severity numbering matches the HP SMH system status.
the event is related. Table 9 (page 46) maps the EMS Hardware Monitors and the corresponding WBEM providers.
Table 11 Command Representation In SysFaultMgmt (System Fault Management) (SFM) Task In EMS Deleting a monitoring request # /etc/opt/resmon/lbin/monconfig Sending a test event # # sfmconfig -t - Changing the status of a device to UP. # set_fixed -n Enter D at the main menu selection prompt.
Table 14 Status values Status values UNKNOWN OTHER OK DEGRADED STRESSED PREDICTIVE FAILURE ERROR NONRECOVERABLE ERROR STARTING STOPPING STOPPED IN SERVICE NO CONTACT LOST COMMUNICATION ABORTED DORMANT SUPPORTING ENTITY IN ERROR COMPLETED The sfmconfig -a -r command is used to change the state of a subsystem. When this command is not working with processor, the user should check for errors.
1. On the System Page of HP SIM, click System Management Homepage, as shown in Figure 4–14. Figure 15 System Page The HP SMH home page is displayed. 2. Perform the relevant steps described in “Viewing instances” (page 53).
5 SysFaultMgmt (System Fault Management) (SFM) support for different virtualization environments This chapter discusses about the following topics: • “Introduction to various virtualization environments” (page 50) • “Summary of various virtualization environments” (page 51) Introduction to various virtualization environments This section describes about the support and behavior of SysFaultMgmt (System Fault Management) (SFM) on different virtualized environments.
Figure 16 Error log processing details on a 6.x (vPar/VM) Guest Figure 16 (page 51) illustrates the process of log errors on a 6.x (vPar/VM) Guest. HP-UX Virtual Partitions (vPars) (referred as Legacy vPars) HP-UX Virtual Partitions (vPars) is also referred as Legacy vPars. For the ease of user benefit and understanding, HP-UX Virtual Partitions (vPars) is mentioned as Legacy vPars in this document.
Table 15 Virtualization Support Matrix on HP-UX 11.31 Host Index nPAR OS HP Integrity VM 4.x VM Host Guest HP-UX Virtual Partitions (vPars) 11.23/ 11.23/ 11.23/ 11.23/ 11.31 11.31 11.31 11.31 HP-UX vPars and Integrity VM 6.x VSP vPar Guest VM Guest 11.31 11.31 11.23 (VM 4.x)/ 11.
6 Administering indications and instances using HP SMH This chapter describes SysFaultMgmt (System Fault Management) (SFM) administration tasks that you can perform using HP SMH on a local system.
NOTE: Starting September 2009 release, in HP SMH GUI, you can refer to “The equivalent command line” option, to view command line information about processors. For more information, view cprop manpage. See "man cprop" 1. Select Show All under System on the HP SMH home page. The system page is displayed. Figure 17 System Management Homepage 2. Select Processors under System on the HP SMH home page. Information about the processors is displayed. 3. To return to the HP SMH home page, click on Home.
Viewing information about System Summary To obtain information about system summary, such as the model, role, UUID, UUID (Logical), Serial number, Serial number (Logical) and many more, complete the following steps: 1. Select System Summary under System on the HP SMH home page. System summary information is displayed. 2. To return to the HP SMH home page, click on Home.
Viewing information about Management Processor To obtain information about the Management Processor (MP), such as its IP address, status, and URL, complete the following steps: 1. Select Management Processor under System on the HP SMH home page. Information about the management processor is displayed. 2. To return to the HP SMH home page, click on Home. Viewing information about Mem Error To obtain information about the memory error, complete the following steps: 1.
Viewing Partition information To obtain the Partition Information, such as the Partition Name, Type, and ID, complete the following steps: 1. Select Partition Information under System on the HP SMH home page. Information about the Partition Information is displayed. 2. To return to the HP SMH home page, click on Home. Viewing information about Blade To obtain information about the Blade, such as the Onboard Administrator and HashID, complete the following steps: 1.
1. Select Processors under System on the HP SMH home page. Information about the Processors is displayed. 2. 3. 4. Select Health Test tab on the Processors page to run a configured Health Test. Select the option Basic Health Test to run basic test configured in the system. Click Run to execute the CPU Health Test. The CPU Health Test results are displayed in the View Health Test Results pane. NOTE: 5. CPU Health Test Results can also be viewed from the command line interface (CLI).
For information on how to configure user groups in HP SMH, see the HP System Management Homepage User’s Guide at http://www.hp.com/go/smh-docs EVWEB supports new IO & Storage native indication providers to display additional info for the following providers: HPUXSASNativeIndicationProviderModule HPUXRAIDSANativeIndicationProviderModule HPUXFCNativeIndicationProviderModule HPUXStorageNativeProviderModule These native indication provider support is available on the HP Integrity Servers.
34). You cannot use the evweb list, evweb subscribe, or the evweb eventviewer command to create and delete Admin Defined event subscriptions. • Event subscriptions created using the HP SMH GUI (Event subscription administration) – You can create these event subscriptions using the GUI or the CLI. You can modify and delete the event subscriptions that are created using Event subscription administration.
• (-i ) • (-v ) • (-o ) • (-t [archive|email][handler_properties] • (-s ) • -h For more information on creating event subscriptions using CLI, see evweb_subscribe(1). Copying and creating a new event subscription using the GUI You can reuse the existing subscriptions to create another subscription. To create an event subscription by copying an existing event subscription, complete the following steps: 1.
You can modify an event subscription in the following ways: • Modify a single event subscription. You can modify a single event subscription using the modify feature by selecting the event subscription from the event subscription table. • Modify similar criteria in multiple event subscriptions. You can modify similar criteria in multiple event subscriptions by using the Copy and modify subscription feature.
If you specify only the subscription criteria and not the destination, then: • If you do not specify -r option, the current destination is removed and the subscription criteria are updated. • If you specify -r option, the current destination is retained and only the subscription criteria are updated. Example 1 Example The existing subscription criteria won't be retained. If email or Syslog destination is configured, the destination will be changed to EventArchive.
6. Select Modify in the Copy and modify subscription page. Evweb modifies the event subscriptions and displays a confirmation message. 7. Click OK on the confirmation message window. NOTE: The Copy and modify subscription feature is available only on the GUI. IMPORTANT: The subscription criteria are not copied when you copy an HP Advised event subscription. Therefore, ensure that you specify the subscription criteria in the Copy and modify subscription page.
-f is a switch used to force the command. This switch can be used only with the -D option. If the -f switch is not used, Evweb prompts for a confirmation before deleting an event subscription. A message stating that the execution of the evweb subscribe command was successful is displayed on the screen. NOTE: Any external subscriptions cannot be deleted, either with CLI or GUI. Using CLI, you can delete only one event subscription at a time.
HP provides some event subscriptions with Evweb. These event subscriptions are known as HP Advised event subscriptions. By default, the HP Advised event subscriptions store the events in the Event Archive. Viewing Evweb event subscriptions You can view summary and detailed information about event subscriptions using Evweb. Viewing a summary of an Evweb event subscription using the GUI To view a summary of the event subscriptions, repeat steps 1-5 from “Launching Evweb for administration” (page 59).
Table 16 Evweb event subscriptions (continued) Field Description Email Displays TRUE if the subscription criterion is configured to send an email to the specified email address, when a WBEM indication is generated. Displays FALSE if the subscription is not configured to send an email. Syslog Displays TRUE if the subscription criterion is configured to store the WBEM indications in the Syslog. Displays FALSE if the subscription criterion is not configured to store the WBEM indications in the Syslog.
Table 17 Details of an event subscriptions Field Description Subscription name Displays the name of an event subscription. Subscription criteria Displays the criteria that are specified for the subscription, for example, severity, event ID, event category, device, and so on. Subscription destination Displays the destination where the WBEM indications are stored, for example, event Archive, email address, and Syslog.
Table 18 External event subscriptions Field Description Filter name Displays the filter name consisting of an event subscriptions. Handler name Displays the handler name consisting of an event subscriptions. Destination URL Displays the destination where the indications are stored. Query Displays the subscription criteria. For information on viewing external subscriptions using the CLI, see evweb_subscribe(1).
1. Log in to the HP SMH. To log in to HP SMH, enter http://:2301 in the address bar of the Web browser. The HP SMH login screen is displayed. 2. 3. Enter your user name and password in the appropriate text boxes. Click Sign In on the login screen. The HP SMH home page is displayed. 4. Select Logs in the main menu. The Logs page is displayed. This page displays the applications that are plugged in to HP SMH. 5. Select Event viewer in Evweb. The Event viewer page is displayed.
Where: -L is an option used to list all the WBEM events. A list of WBEM events is displayed.
2. Select the desired WBEM event in the List Events table. The Details of the Event page is displayed. This page includes a table that provides detailed information about the WBEM events. For information on viewing detailed information of the WBEM events using the HP SMH GUI, select Help on the action pane of the List Events page.
• -s[asc|desc] () • -f • -n • -b [history|current] For information on deleting WBEM events using the CLI, see evweb_eventviewer(1). Viewing Low Level Logs using Evweb This section describes how to perform administration tasks such as searching and viewing low level log information.
Four operations can be performed using the utility: • Backup: Back up is the process of taking backup of all the databases including current and archived database. It is initiated by the administrator. The administrator must execute this utility with the argument bkup with the destination file name. The data directory is considered to be the destination. /opt/sfm/bin/sfmDBUtil bkup dbbackup • Restore: Restore is the process of restoring backed up data and it is initiated by the administrator.
Searching Low Level Logs using Advanced Search To search the log database for low level logs using Log Viewer, complete the following steps: 1. Repeat steps 1-5 from “Searching Low Level Logs using Simple Search” (page 74). 2. Select Advanced Search on the right pane of the Log Viewer page. The Advanced Search page is displayed. 3. 4. Provide appropriate information in the fields present in the Advanced Search page. Click Search on the Advanced Search page.
1. 2. Repeat steps 1-5 from “Searching Low Level Logs using Simple Search” (page 74). Depending on the information you have, perform either a simple search or an advanced search. Based on the search criteria, the log records are displayed in a tabular format. For information on viewing the low level logs using GUI, select Help on the action pane of the Log Viewer page.
2. Depending on the information you have, perform either a simple search or an advanced search. Based on the search criteria, the log records are displayed in the Log Summary Table. 3. Select the desired low level log from the Log Summary Table. The details of a low level log is displayed in the Log Viewer page. For information on viewing the low level logs using GUI, select Help on the action pane of the Log Viewer page.
Tracing is a feature that enables you to log and report errors. You can use tracing to log information about problems encountered while using Evweb. In this document, this information is referred to as trace records. The trace records are stored in the /var/opt/sfm/log/sfm.log file. The logs are written when SysFaultMgmt (System Fault Management) (SFM) is running. These logs are Warning, informational, Milestone etc based on the kind of severity set by the user. You can send the sfm.
Table 20 Trace Levels (continued) Trace Level Description Both critical and error situations are logged at the Warning trace level. 4-Information The system logs situations that result in information messages. Example: An information message is generated when a non-administrator attempts to perform a task that can be performed only by an administrator. Critical, error, and warning situations are logged at the Information trace level. The default trace level is Warning.
Tracing is now enabled. The trace value is the trace level that you have set. Modifying Tracing using the Evweb GUI To modify tracing, complete the following steps: 1. Log in to the System Management Homepage. To log in to HP SMH, enter http://:2301 in the address bar of a Web browser. The HP SMH login screen is displayed. 2. 3. Enter your user name and password in the appropriate text boxes. Click Sign In on the login screen. The HP SMH home page is displayed. 4.
5. Select Disable Tracing available on the top right corner of the page. The tracing is disabled and a confirmation message is displayed. 6. Click OK on the confirmation message window. For more information on disabling tracing using the HP SMH GUI, select Help on the action pane of either the Event Viewer or the Event Subscription Administration page. Disabling Tracing using the Evweb CLI To disable tracing using the Evweb CLI, you must reset the trace value.
Launching EMT You can launch EMT either through the CLI or the GUI. To launch EMT using the CLI, enter the following command at the HP-UX prompt: # /opt/sfm/bin/emtui To launch EMT using the HP SMH GUI, complete the following steps: 1. Log in to the HP SMH. To log in to the HP SMH, enter http://:2301 in the address bar of the Web browser. The HP SMH login screen is displayed. 2. 3. Enter your user name and password in the appropriate text boxes. Click Sign In on the login screen.
Following are the match types: -i • any (default) - Searches for at least one word specified in the query string. • all - Searches for all words specified in the query string. • phrase - Searches for the exact phrase specified in the query string. is an option that enables you to specify the error number. Error number is a unique identification number for the errors present in CER.
# emtui -b Where: -b is an option used to view information about events in brief. A list of events in CER is displayed. For more information on viewing summary information about an event in CER using the CLI, see emtui(1). Viewing Detailed Information using the GUI You can view detailed information about an event by clicking on any row in the Error Summary Table. To view detailed information about an event stored in CER using the HP SMH GUI, complete the following steps: 1.
3. Click on the desired event from the Event Summary Table. The details of the event is displayed in the Detailed Error Information (Administrative View) pane. 4. If there is no cause associated with the event, skip to “Step 5” (page 85). If a cause is associated with the event, select the cause for the event from the Detailed Error Information (Administrative View) pane. You can select multiple causes for an event. 5.
5. Modify the information in the text boxes in the Modify a Custom Solution page, and click Modify Solution. A confirmation message is displayed. 6. Click OK on the confirmation message window. The modified custom solution is displayed on the Detailed Error Information (Administrative View) pane. For more information about modifying a custom solution using the HP SMH GUI, select Help on the action pane of the Modify a Custom Solution page.
You can also use the following switches with the -m option: • -c • -i For information on deleting custom solution in the CER using the CLI, see emtui(1). Tracing EMT This section provides an overview of tracing and information about the various trace levels in EMT. This section also describes how to enable, modify, and disable tracing.
2. Select Enable Tracing on the top right corner of the page. The Enable Tracing page is displayed. 3. 4. Set the trace level by selecting the level from the trace level list. Select Enable Tracing. The tracing level is set and a confirmation message is displayed. 5. Click OK on the confirmation message window. For more information about enabling tracing using the HP SMH GUI, select Help on the action pane of the Enable Tracing page.
Disabling Tracing using the EMT CLI To disable tracing using the EMT CLI, you must reset the trace value. To reset the trace value, enter the following command at the HP-UX prompt: # unset EMT_TRACE_LEVEL Tracing is now disabled. NOTE: Tracing is automatically disabled at the end of an EMT session.
7 Troubleshooting SysFaultMgmt (System Fault Management) (SFM) This chapter describes how to troubleshoot SysFaultMgmt (System Fault Management) (SFM) providers and EVWEB. This chapter addresses the following topics: • “Troubleshooting instance providers” (page 90) • “Troubleshooting indication providers” (page 95) • “Troubleshooting EVWEB” (page 100) For information on Upgrade Installation of the Postgres 8.4.8, see the Installation scenarios of Postgres 8.4.8 at www.hp.
Table 22 Troubleshooting instance providers (continued) Problem Cause Solution 5. After the CIMOM restarts, follow the process from the step 1 mentioned above. 6. After the provider module is registered, create a link between SysFaultMgmt (System Fault Management) (SFM) providers and the CIMOM by entering the following command at the HP-UX prompt: On Itanium-based systems, enter: # ln -s /opt/sfm/lib/libsfmproviders.1\ /opt/wbem/providers/lib/libsfmproviders.
Table 22 Troubleshooting instance providers (continued) Problem Cause Solution 1. Enter the following command at the HP-UX prompt to disable SFMProviderModule: # cimprovider –d –m SFMProviderModule 2. Enter the following command at the HP-UX prompt to enable SFMProviderModule: # cimprovider –e –m SFMProviderModule Alternatively, you can enter the following command at the HP-UX prompt to start SFMProviderModule: # sh /opt/sfm/bin/restart_sfm.sh The logs to /var/opt/sfm/log/state.
Table 24 Troubleshooting instance providers (continued) Problem: Requests for instances do not return any value. Causes Solution To restart the CIMOM, enter the following command at the HP-UX prompt: # cimserver Cause 2 The provider is not registered properly. To register the provider, complete the following steps: 1. Enter the following command at the HP-UX prompt: # cimprovider -ls | grep SFMProviderModule 2.
Table 24 Troubleshooting instance providers (continued) Problem: Requests for instances do not return any value. Causes Solution # cimprovider -ls Following is a sample output of the command: MODULE OperatingSystemModule ComputerSystemModule ProcessModule IPProviderModule SFMProviderModule STATUS OK OK OK OK Degraded If the status of SFMProviderModule is Degraded as displayed in the given output, SFMProviderModule is not running. To enable SFMProviderModule, complete the following steps: 1.
Table 26 Troubleshooting instance providers (continued) Problem: Indications fulfilling the conditions defined in the HP-Known HP-Defined filters, are not logged in the Event Archive. Cause Solution PAGE 96Table 28 Troubleshooting indication providers (continued) Problem: Indications corresponding to events generated by the Event Monitoring Service (EMS) monitors, are not logged in the Events List. Causes Solution ComputerSystemModule ProcessModule IPProviderModule SFMProviderModule OK OK OK Degraded If the status displayed is not OK, the provider module is not registered properly.
Table 28 Troubleshooting indication providers (continued) Problem: Indications corresponding to events generated by the Event Monitoring Service (EMS) monitors, are not logged in the Events List.
Table 28 Troubleshooting indication providers (continued) Problem: Indications corresponding to events generated by the Event Monitoring Service (EMS) monitors, are not logged in the Events List. Causes Solution FRUProvider EvmCimProvider Cause 4 Subscriptions do not exist. Create the following enumerateInstances_sub.xml file and save it in any location: PAGE 99Table 28 Troubleshooting indication providers (continued) Problem: Indications corresponding to events generated by the Event Monitoring Service (EMS) monitors, are not logged in the Events List. Causes Solution CIM_ComputerSystem hpdst348
Table 28 Troubleshooting indication providers (continued) Problem: Indications corresponding to events generated by the Event Monitoring Service (EMS) monitors, are not logged in the Events List. Causes Solution Use the information available in the file to analyze the problem. 6. When you complete testing, revert to the default severity settings in the FMLoggerConfig.xmlfile using a text editor. If you do not revert to the default settings, the logs consume more disk space.
Table 29 Troubleshooting EVWEB (continued) Problem Cause Solution If the Event Archive Database service is running and the problem persists, check for error logs in the /var/opt/sfm/log/sfm.log file. For further assistance, contact the HP support center. While you are accessing an event from the Event Archive, either of the following errors are displayed: You receive the first message, if EVWEB is unable to access the details of an event stored in the Event Archive.
Table 29 Troubleshooting EVWEB (continued) Problem Cause Solution Cause 2 Change the sender address defined in Event mails are blocked /var/opt/sfm/conf/evweb.conf to suit your domain. as SPAM mails because Enter the following command at the HP-UX prompt: the sender address of # sfmconfig -c /var/opt/sfm/conf/evweb.conf event mails, evweb@hp.com, is not allowed to send a mail in your different domain network. WBEM Indications are not SFMProviderModule is mailed to your email not running. address.
Table 29 Troubleshooting EVWEB (continued) Problem Cause Solution process as the sfmdb user. "+" in the message indicates the su attempt is successful (if "-" is present instead of "+", it indicates the attempt fails). This message is harmless, it does not indicate a problem with the installation Both EMS and SysFaultMgmt (System Fault Management) (SFM) log the same symptom in the Syslog. The Syslog functionality is available from SysFaultMgmt (System Fault Management) (SFM) Version C.06.00.07.
Table 29 Troubleshooting EVWEB (continued) Problem Cause Solution For more information, see the HP Operations Manager Software for UNIX documentation.
A EMT Message Definition Following is a sample EMT Message file: $ Descriptor Header begins $ <> DescriptorID=0000023100000010800000AA006D2EA3 $ <> ProductName = myProduct $ <> ProductID = ID $ <> ProductEmailAlias=myproduct@abc.com $ <> OrgName = myorg $ <> OrgType = ISV $ <> Subsystem={(Type=EMS, Name= dm_chassis),(Type=WBEM, Name=FileSystemProvider)} $ <> ProductCategory=Kernel $ <> MsgCat={ID=1,(Path=./ lvmcommonmessages.cat, Locale= ja_JP.
Table 30 EMT Message File Description (continued) Tag Description Usage ProductCategory Specify one or more of the following product ProductCategory= categories that best describes your product: Kernel,IO,Network • Hardware • Network • IO • Kernel • Commands • Others MsgCat Specify a list of message catalogs. The MsgCat tag has the following attribute: ID – A unique number used to identify an error message. MsgCat={(ID=1, Path=../../../bin/cat/en_US.iso88591/module1.cat,LocaleName= en_US.
Table 30 EMT Message File Description (continued) Tag Description Usage a given error message. However, if there is only one cause and one or more corrective action for a given error message, the Action tags are associated with the Cause tag. In such a situation, the Cause_Action tag is not mandatory. For any error, a cause can be specified without specifying the corrective action. However, a corrective action cannot be specified without specifying a cause.
B Interpretation of HP SMH instances This appendix describes the fields and enables you to interpret the instances in the HP SMH property pages.
Processor instances This section describes the processor instances. Figure 21 Sample Processors property page Table 31 (page 109) describes the fields and enables you to interpret the values displayed in Figure 21 (page 109). Table 31 Description of the Processors Fields and Values Fields and Values Description Status Indicates the status of the processors. An OK status indicates that all the processors are functioning properly. Click Events to see the details of the errors.
Memory instances This section describes the memory instances. Figure 22 Sample Memory property page Table 32 (page 110) and Table 33 (page 111) describes the fields and enables you to interpret the values displayed in Figure 22 (page 110). Table 32 Description of the Memory Slots Fields and Values 110 Fields and Values Description Status Indicates the status of the memory module. An OK status indicates that all the modules are configured properly.
Table 32 Description of the Memory Slots Fields and Values (continued) Fields and Values Description Part Number Indicates the part number of the memory. HashID Identifies an instance of the device. Table 33 Description of the Empty Slots Fields and Values Fields and Values Description Location Indicates the location of the memory. Attributes such as Cabinet Number, Cell Slot, and DIMM Slot help narrow down the location of the memory module.
Table 34 Description of the Memory Slots Fields and Values (continued) Fields and Values Description Logical memory information Physical memory information Device Bay Information NOTE: 112 Indicates the URL to launch the blade information page on the OA. Memory information displayed is as viewed from a hard partition (nPar).
System Summary instances This section describes the system summary instances. Figure 24 Sample System Summary property page Table 35 (page 113), Table 36 (page 114) and Table 37 (page 114) describes the fields and enables you to interpret the values displayed in Figure 24 (page 113). Table 35 Description of the General Information Fields and Values Fields and Values Description Model Describes the system model.
Table 35 Description of the General Information Fields and Values (continued) Fields and Values Description UUID (Logical) Indicates the UUID of the logical server. A logical server is a software configuration that can be applied to a server blade or a virtual machine. Also, you can move a logical server from one server blade or a virtual machine to another. However, when you move a logical server, the logical server identities are retained.
Cooling Device instances This section describes the cooling device instances. Figure 25 Sample Cooling device property page Table 38 (page 115) describes the fields and enables you to interpret the values displayed in Figure 25 (page 115). Table 38 Description of the Cooling Device Fields and Values Fields and Values Description Status Indicates the status of the fans. An OK status indicates that all the modules are configured properly.
Power supply instances This section describes the power supply instances. Figure 26 Sample Power property page Table 39 (page 116) describes the fields and enables you to interpret the values displayed in Figure 26 (page 116). Table 39 Description of the Power Supply Fields and Values 116 Fields and Values Description Status Indicates the status of the power supply. An OK status indicates that the power supplies are configured properly.
Temperature instances This section describes the temperature instances. Figure 27 Sample Temperature property page Table 40 (page 117) describes the fields and enables you to interpret the values displayed in Figure 27 (page 117). Table 40 Description of the Temperature Fields and Values Fields and Values Description Status Indicates whether the sensor temperature in the system is normal or not. However, the status of the sensor temperature does not reflect the status of the cooling devices.
Voltage instances This section describes the voltage instances. Figure 28 Sample Voltage property page Table 41 (page 118) describes the fields and enables you to interpret the values displayed in Figure 28 (page 118). Table 41 Description of the Voltage Fields and Values 118 Fields and Values Description Status Indicates whether the sensor voltage in the system is normal or not. An OK status indicates that the sensor voltage in the system is normal. HashID Identifies an instance of the device.
FRU Information instances This section describes the FRU Information instances. Figure 29 Sample FRU Information property page Table 42 (page 119) describes the fields and enables you to interpret the values displayed in Figure 29 (page 119). Table 42 Description of the MP Fields and Values Fields and Values Description Name Indicates the FRU Name of the Physical Element. Serial Number Indicates the serial number of the FRU. HashID Identifies an instance of the device.
Management Processor instances This section describes the Management Processor (MP) instances. Figure 30 Sample MP property page Table 43 (page 120) describes the fields and enables you to interpret the values displayed in Figure 30 (page 120). Table 43 Description of the MP Fields and Values Fields and Values Description Status Indicates whether the Management Processor (MP) is functioning properly or not. An OK status indicates that the MP is functioning properly.
Memory Error instances This section describes the Mem Error instances. The Mem Error property page displays PDT information in the Legacy server and PET information in NGIS server. Figure 31 Sample PDT Memory Error property page Table 44 (page 121) describes the fields and enables you to interpret the values displayed in Figure 31 (page 121). Table 44 Description of the Memory Error PDT Fields and Values Fields and Values Description HashID Identifies an instance of the device.
NOTE: There are some special cases in PDT memory error when using the cprop command by CLI or navigating to “SMH > System > Mem Error” property page: Case 1 # cprop -summary -c "Mem Error" [Component]: Mem Error This case indicates that there is no PDT memory error in this server at all.
Table 45 Description of the Memory Error PET Fields and Values (continued) Fields and Values Description Device Indicates in which device the error is found. Width Indicates the width of the device. Error Count Error count occurred in each DRAM. Error State Indicates the state of the error. Error DCK State Indicates the state of DCK error. Rank Indicates the rank of the error. Rank Size Indicates the entries of the memory rank sizes.
Firmware Information instances This section describes the Firmware Information instances. Figure 33 Sample Firmware Information property page Table 46 (page 124) describes the fields and enables you to interpret the values displayed in Figure 33 (page 124). Table 46 Description of the Firmware Information Fields and Values 124 Fields and Values Description Name Indicates the name of the entity, such as the system firmware, MP, or the system backplane cell, whose firmware information is displayed.
Enclosure Information instances This section describes the Enclosure instances. Figure 34 Sample Enclosure property page Table 47 (page 125) describes the fields and enables you to interpret the values displayed in Figure 34 (page 125). Table 47 Description of the Enclosure Information Fields and Values Fields and Values Description Status Indicates the status of the enclosure. An OK status indicates that the components of the enclosure are functioning properly.
Complex-wide Info instances This section describes the Complex-wide Info instances. Figure 35 Sample Complex-wide Info property page Table 48 (page 127), Table 49 (page 127) and Table 50 (page 127) describes the fields and enables you to interpret the values displayed in Figure 35 (page 126).
Table 48 Description of the Complex Information Fields and Values Fields and Values Description Complex Name Describes user defined name for the complex. Model Defines Model identification string. Serial Number Indicates the serial number of the complex as assigned by the original manufacturer. Revision Displays string for the revision number of the profile, consisting of the major and minor revision numbers concatenated with a period as a separator.
Cell Board instances This section describes the Cell Board instances. Figure 36 Sample Cell Board property page Table 51 (page 128) describes the fields and enables you to interpret the values displayed in Figure 36 (page 128). Table 51 Description of the Cabinet Fields and Values 128 Fields and Values Description Firmware Version Displays string for the firmware revision number, consisting of the major number separated from the minor number by a period. Status Indicates the status of the component.
Table 51 Description of the Cabinet Fields and Values (continued) Fields and Values Description Total Processor Slots Indicates the number of processor module slots on the cell. Total Empty Processor Slots Indicates the number of all empty processor slots. Processors Per Module Indicates the number of processors per processor module on the cell. Total Installed Processor Modules Indicates the number of all installed processor modules in the cell.
Partition Information instances This section describes the Partition Information instances. Figure 37 Sample Partition Information property page Table 52 (page 130) describes the fields and enables you to interpret the values displayed in Figure 37 (page 130). Table 52 Description of the Partition Fields and Values Fields and Values Description Partition Name Describes user defined name with the numeric label for the Partition. nPartition ID Indicates the ID of the nPartition in the complex.
Table 52 Description of the Partition Fields and Values (continued) Fields and Values Description Total Deconfigured Processor Modules Indicates the number of all deconfigured processor modules in the partition. Total Installed Memory Displays the total amount of memory installed in the partition, in megabytes. Total Installed Cells Indicates the number of all cells installed in the partition. Total Active Cells Indicates the number of all active cells in the partition.
Blade instances This section describes the Blade instances. Figure 38 Sample Blade property page Table 53 (page 132) describes the fields and enables you to interpret the values displayed in Figure 38 (page 132). Table 53 Description of the Blade Fields and Values 132 Fields and Values Description Status Indicates the status of the blade. Hardware Path Indicates the hardware path of the blade. Serial Number Indicates the serial number of the blade.
Cell Blade instances This section describes the Cell Blade instances. Figure 39 Sample Cell Blade property page Table 54 (page 133) describes the fields and enables you to interpret the values displayed in Figure 39 (page 133). Table 54 Description of the Cell Blade Fields and Values Fields and Values Description Status Indicates the status of the blade. Hardware Path Indicates the hardware path of the blade.
Launch the Onboard Administrator To access the Onboard Administrator (OA) from the property pages, complete the following steps: 1. Click on the Onboard Administrator link from the property page. Figure 40 Onboard Administrator 2. 134 The OA login page opens in a new browser window.
Figure 41 OA login page 3. Enter the Onboard Administrator User name and Password.
C Syslog property order This appendix describes the order for the properties (IndicationIdentifier, EventID, PerceivedSeverity, ProviderName and Summary) in the event message which is written in Syslog by the HP_defaultSyslog subscription. NOTE: The term “Legacy” refers to HP Integrity Servers with Intel(R) Itanium(R) processors, which are older than 9300. The term “HP Integrity Servers” refers to those, with Intel(R) Itanium(R) Processors with 9300 or 9500 Series.
D Syslog facility and level This appendix describes about the facility and the level of information, for the event messages, which are logged on to Syslog. See “Syslog property order” (page 136) for more details on Syslog. Table 58 (page 137) describes various levels and facilities of Syslog.
E SysFaultMgmt (System Fault Management) (SFM) configuration files This appendix describes the items of different configuration files in SysFaultMgmt (System Fault Management) (SFM). The user can configure the following five files: • “DBConfig.xml” (page 138) • “FMLoggerConfig.xml” (page 139) • “evweb.conf” (page 140) • “InternalHealthDaemon.cfg” (page 140) • “SFMConfig.xml” (page 141) DBConfig.xml The DBConfig.
Table 59 DBConfig.xml file configuration parameters (continued) Default Range value value Parameter Description of pages that the DB can hold or DBRecordLifeTime criteria, whichever is met first. EvwebDBConfig/ 365 ArchedRecordLifetime 30 to 365 Argument is NUMBER OF DAYS: Indicates the number of days that the events are kept in the history database, before deleting them permanently. FMLoggerConfig.xml The FMLoggerConfig.
evweb.conf The evweb.conf is a configuration file used to set parameters used by the email consumer. SysFaultMgmt (System Fault Management) (SFM) allows the evweb.conf being modified at anytime and take effect immediately by executing the following command: NOTE: If the email server is not set to local machine, it is required to add hostname of generating events server into /etc/mail/sendmail.cw file on the email server and restart sendmail of the email server.
Table 62 InternalHealthDaemon.cfg file configuration parameters (continued) Parameter Default value Range value Description Advisory mode instructs user to execute a particular script to come out of the erroneous state. HealthDaemonState ENABLE ENABLE, This tag is to enable or disable internal health daemon job. DISABLE SFMConfig.xml This is the main configuration file for SysFaultMgmt (System Fault Management) (SFM). It contains tunable parameters for FPL Indication provider.
F Interdependency between SysFaultMgmt (System Fault Management) (SFM) and SysFW This section describes about the special interdependency, that exists between SysFaultMgmt (System Fault Management) (SFM) and SysFW on BL860c i4, BL870c i4, BL890c i4, rx2800 i4 and rx2900 i4. On the prior mentioned servers, SysFaultMgmt (System Fault Management) (SFM) (version C.07.12 or later) or WBEMMgmtBundle (version C.07.01 or later) require SysFW version 44.
Glossary A-B Admin-defined event subscription Subscriptions created by the administrator using the CLI. These subscriptions cannot be deleted. Admin-defined filters Filters that can be created, deleted, and modified to set the criteria for indications that must be logged. C Central Management Server (CMS) The server monitoring the client systems in the network using SysFaultMgmt (System Fault Management) (SFM).
EVWEB User component that enables administering and viewing WBEM indications generated on the system on which SysFaultMgmt (System Fault Management) (SFM) is installed. External subscriptions These are subscriptions created by tools other than EVWEB. H HP System Management Homepage (HP SMH) HP's management application installed on the local system that uses WBEM instrumentation on operating systems such as HP-UX, Linux, and Windows.
S sfmdb The output of a command that indicates that Event Archive Database service is running properly. subscription Configuring SysFaultMgmt (System Fault Management) (SFM) for consumers to receive indications. For example, HP SIM could subscribe to indications generating on hardware devices on a system. SysFaultMgmt (System Fault Management) (SFM) The name of the bundle that includes SysFaultMgmt (System Fault Management) (SFM) software.
Index A administrator, 58, 81 Autoselect dependency, 23 B benefits SFM, 10 C Central Management Server see CMS CER, 81 CIMOM, 19 cimserver, 90, 93 -s option, 90, 92 cimserver -s, 90, 93 CMS, 19 command-line interface, 22 Common Information Model Object Manager see CIMOM configuration monitor mode, 35 SFM, 23 cooling devices on a system, 55 creation subscription, 37 custom solution adding, 84 deleting, 86 modifying, 85 D delete event subscription, 64 WBEM indication, 72 documentation providing feedback on
slview, 11 System Page of HP SIM, 49 J T jobid, 28 temperature status, 55 terminal user interface, 22 tracing, 77, 87 troubleshooting, 101 EMS Wrapper Provider, 98, 99 Event Archive, 100, 101, 102 module, 96 L Log Viewer, 73 Archive Log Database, 73 Current Log Database, 73 Logfile, 27, 28 logs /var/opt/sfm/log/sfm.log file, 78, 87 /var/sam/log/samlog.log file, 79 V non-administrator, 58, 81 /var/sam/log/samlog.
8 Support and other resources About this document This document describes how to install, administer, and troubleshoot SysFaultMgmt (System Fault Management) (SFM) software and its components. Document updates may be issued between editions to correct errors or to document product changes. To ensure that you receive the updated or new editions, subscribe to the appropriate product support service. Contact your local HP sales representative for more information.
Chapter 3 Configuring indication providers Instructs how to configure the indication filters and error logging. Chapter 4 Administering Indications using HP SIM Describes how to use the HP Systems Insight Manager (HP SIM) GUI to administer indications on remote systems. Chapter 5 Administering Indications and instances using HP SMH Describes how to use the HP System Management Homepage (HP SMH) GUI to administer indications and view instances on the local system.
Table 65 HP-UX Releases Release identifier Release name Supported processor architecture B.11.31 HP-UX 11i v3.0 Intel, Itanium, PA-RISC New and changed information in this edition • The Table 4 (page 16) lists the instance and indication providers support on different platforms.
9 Documentation feedback HP is committed to providing documentation that meets your needs. To help us improve the documentation, send any errors, suggestions, or comments to Documentation Feedback (docsfeedback@hp.com). Include the document title and part number, version number, or the URL when submitting your feedback.