System Fault Management C.07.04.07.
© Copyright 2011 Hewlett-Packard Development Company, L.P Legal Notices ©Copyright 2011 Hewlett-Packard Development Company, L.P.Confidential computer software. Valid license from HP required for possession, use or copying. Consistent with FAR 12.211 and 12.212, Commercial Computer Software, Computer Software Documentation, and Technical Data for Commercial Items are licensed to the U.S. Government under vendor’s standard commercial license.
Contents 1 Introduction...............................................................................................7 Overview................................................................................................................................7 Features and Benefits................................................................................................................7 Components of SFM......................................................................................................
Viewing FRU Information.....................................................................................................46 Viewing Information About Management Processor................................................................47 Viewing Information About Firmware Information....................................................................47 Viewing Information About Onboard Administrator................................................................
Viewing List of Low Level Logs..............................................................................................66 Viewing List Of Low Level Logs Using GUI.........................................................................66 Viewing List Of Low Level Logs Using CLI..........................................................................66 Viewing Details of Low Level Logs.........................................................................................
Temperature Instances...........................................................................................................106 Voltage Instances..................................................................................................................107 FRU Information Instances......................................................................................................108 Management Processor Instances....................................................................................
1 Introduction The System Fault Management (SFM) supports HP Integrity Superdome 2 (HP Superdome 2). HP Integrity BL860c i2, BL870c i2 & BL890c i2 Server Blades and rx2800 i2 in addition to other HP Integrity Servers. All the features supported on systems running the HP-UX 11i v3 operating system are available for HP Integrity Servers. This chapter introduces you to the System Fault Management (SFM) software and the tools that SFM includes.
• Enables you to view and administer WBEM indications. • Provides the same features and benefits as those found in the EMS Hardware Monitors. NOTE: 8 Introduction SFM is the replacement of EMS Hardware Monitors.
Components of SFM This section discusses the following topics: • EVWEB • Error Management Technology (EMT) • CIMUtil • IPMI Event Viewer • Providers EVWEB EVWEB is a component of SFM that enables you to administer and view WBEM indications generated on the local system on which SFM is installed. For more information on EVWEB, see “Evweb Overview” (page 49). EMT EMT is a component of SFM that enables you to view and administer information about errors which can occur on the server.
Table 1 Instance Providers (continued) Instance Provider Description NOTE: The Blade Instance Provider is available on BL860c / BL870c / BL890c HP Server, HP Integrity Superdome 2.
Table 1 Instance Providers (continued) Instance Provider Description For more information on the DAS provider, see the HP-UX WBEM Direct Attached Storage (DAS) Provider Data Sheet and Release Notes at: http:// www.hp.com/go/hpux-wbem-docs Management Processor Retrieves information about the management processor on the system.
Table 1 Instance Providers (continued) Instance Provider Description Blade CPU Memory Environmental Firmware Revision Management Processor Enclosure Temperature Sensor Indication Providers SFM includes four indication providers, the EMS Wrapper Provider, the Event Manager Common Information Model (EVM CIM) Provider, SFMIndicationProvider and MCA Indication Provider. Table 2 describes the SFM indication providers.
Table 2 Indication Providers (continued) Indication Provider Description 1. Converts hardware, software, and kernel events generated by the EVM into WBEM indications. 2. Reports the WBEM indications to the CIMOM. Using a WBEM-based management application, such as HP SIM, you can subscribe to and receive EVM events generated on a remote system. On the system on which SFM is installed, you can use an SFM tool, called EVWEB, to view and administer events through the HP SMH interface. 3.
NOTE: The following apply to indication providers: • The terms events and indications are used interchangeably. • Although both EMS Wrapper Provider and EVM CIM Provider generate events related to system hardware, the nature of events are different. In addition, the support for CPUIndicationProvider and MemoryIndicationProvider has been added with additional support for hardware events on HP Integrity BL860c i2, BL870c i2 & BL890c i2 Server Blades.
1 Legacy : HP Integrity platforms supporting processors prior Intel 9300.
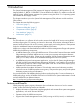
Figure 1 Block Diagram of SFM The following list describes the sequence of events when a request is made for information: 1. The CIMOM receives requests from the CMS for information about devices. 2. The CIMOM directs the requests to the appropriate SFM provider, for example, the CPU Instance Provider. 3. The SFM provider queries the associated hardware device for property information. 4. The SFM provider returns the query information to the CIMOM. 5.
4. The CIMOM directs these indications to EVWEB and to the CMS that has created subscriptions for indications. EVWEB then stores the indications either in the Event Archive, in syslog, or in your E-mail box, or all, depending on your configuration. Indications can be viewed using HP SIM on the remote system and HP SMH on the local system. 5. The indications generated by the SFMIndicationProvider, and reported to the CIMOM, can also be directed to the EMS framework through the WBEM Wrapper Monitor.
2 Installing the SFM Software The System Fault Management (SFM) software is installed by default with the HP-UX 11i v3 Operating Environment (OE) media. However, at some point you may need to install the SFM software separately. This chapter describes how to install the SFM software as a standalone component on the HP-UX 11i v3 operating system.
NOTE: • WBEM Services, Online Diagnostics, SysMgmtWeb, and HP SIM are available on the Operating Environment (OE) media and can be selected for install during the SFM installation. • HP System Management Homepage (SMH) – bundled in SysMgmtWeb. You cannot access the EvWEB GUI (Event Viewer, Subscription Administration and Log Viewer interface), EMT(Error Management Technology) GUI and IPMI Event Viewer GUI without HP SMH.
Selecting these options automatically installs all the dependencies. NOTE: The system selects some options by default. However, you must select the two options mentioned in step 5 to automatically install the prerequisites. 7. 8. Click OK in the Note window to confirm the selection of dependencies. In the SD Install - Software Selection window, select Actions->Install, as shown in the following figure.
When the SFM software installs, the Install window appears indicating that the SFM software is installed successfully, as shown in the following figure: 9. Unmount the CD. To unmount, enter the following command at the HP-UX prompt: # unmount /tmp/cdrom 10.
3. To install the SFM software and all the dependencies, enter the following command at the HP-UX prompt: # swinstall -x autoselect_dependencies=true -x enforce_dependencies=true -s /tmp/cdrom SysFaultMgmt 4. Unmount the CD. To unmount, enter the following command at the HP-UX prompt: # unmount /tmp/cdrom 5.
1. 2. Log in to the system as a superuser. Click Logfile in the Install window, as shown in the following figure: The Logfile, which includes details about the installation, is displayed. If there are no errors in the Logfile, the SFM software is installed properly. If the SFM software is not installed properly, you must repeat the installation procedure. 3.
2. Enter the following command at the HP-UX prompt: # swjob If the output contains no errors, the SFM software is installed properly. Otherwise, you must install the SFM software again. A sample output is shown in the following figure: 3. For information about installation-related errors, enter the following command at the HP-UX prompt: # swjob -a log @ :/ For example, enter the following command at the HP-UX prompt: # swjob -a log iemlhamia-0005 @ iemlhamia.india.hp.
4. Select Actions->Mark for Remove in the SD Remove window, as shown in the following figure: 5.
6. Click OK in the Remove Analysis window to confirm the removal of the SFM software, as shown in the following figure: The following figure is a sample of the removal process in progress: 7.
8. To verify whether the SFM software is removed properly, enter the following command at the HP-UX prompt: # swlist | grep SysFaultMgmt If the SFM software is removed properly, SysFaultMgmt and the version number of the SFM software does not appear in the output. If the SFM software is not removed properly, you must repeat the removal procedure. For more information, see “Verifying Removal of the SFM Software” (page 27).
3. For information about errors related to the removal of SFM, enter the following command at the HP-UX prompt: # swjob -a log @ :/ The jobid is available in the Logfile. Verifying Removal Using the CLI To verify if the SFM software is removed successfully, complete the following steps: 1. Log in to the system as a superuser. 2. Enter the following command at the HP-UX prompt: # swjob If the output contains no errors, the SFM software is removed successfully.
3 Configuring Indication Providers This chapter describes how to configure indication filters, error logging, and the SFMIndicationProvider. Configuring Indication Filters You must configure the indication filters to view desired indications. You use the Filter Metadata Provider (FMD) to configure indication filters that deliver important or desired indications, for example, indications with a certain severity.
Filter Filter Filter Filter Filter Filter Filter Unique Identifier Query Query Language Source Namespace Description State Last Operation : : : : : : : 10002 Select * from HP_AlertIndication where (PerceivedSeverity >= 4) WQL root/cimv2 Admin Filter Enabled Filter State Add Filter HP_AlertIndication is derived from CIM_AlertIndication and HP_DeviceIndication is derived from HP_HardwareIndication. HP_HardwareIndication is derived from HP_AlertIndication.
Sending test event for memory monitor. NOTE: You can also send test events for other devices that the SFMIndicationProvider monitors. For information on the devices monitored by the SFMIndicationProvider, see Table 2 (page 12). To view the list of events, enter the following command at the HP-UX prompt: # evweb eventviewer -L A list of events along with the details such as event number, severity, and event category are displayed by querying the Event Archive.
4 Administering Indications and Instances Using HP SIM This chapter describes System Fault Management (SFM) administration on a remote system using HP Systems Insight Manager (HP SIM). NOTE: You can perform similar tasks using other management applications that are compliant with the Common Information Model (CIM) (2.7.2) schema (or later) of the Distributed Management Task Force (DMTF). The terms events and indications are used interchangeably in this document.
2. To create subscriptions, select Options-->Protocol Settings-->Global Protocol Settings in the HP SIM Home page, as shown in Figure 4-1. Figure 2 HP SIM Home Page The Global Protocol Settings window is displayed, as shown in Figure 4-2. Figure 3 Global Protocol Settings 3. In Figure 4-2, under Default WBEM settings, select Enable WBEM. Click OK to save your settings.
4. Select Configure->Configure or Repair Agents, as shown in Figure 4-3. Figure 4 Configuration The Configure or Repair Agents window is displayed, as shown in Figure 4-4. Figure 5 Configure or Repair Agents 5. 34 From the Add targets by selecting from: list in Figure 3-4, select All Systems to view and select the systems.
the selected system. The list of systems is displayed in the Select Target Systems window, as shown in Figure 6. Figure 6 Select Target Systems 6. To select all the systems in the network, select the Select “All Systems” itself check box, as shown in Figure 4-5. Click Apply. The Verify Target Systems window is displayed, as shown in Figure 4-6.
7. Select the appropriate check box to verify the target systems and click Next, as shown in Figure 4-6. The Enter Credentials window is displayed, as shown in Figure 4-7. Figure 8 Enter Credentials 8. Enter your credentials in the given fields, as shown in Figure 4-7. Click Next. The Configure or Repair Settings window is displayed, as shown in Figure 4-8. Figure 9 Configure or Repair Settings 9. On the Configure or Repair Settings window, click Run Now.
Figure 10 Task Results 10. To obtain a printable report of the indication subscription details, click View Printable Report at the bottom of the window. The report is displayed, as shown in Figure 4-10. Figure 11 Printable Report of the Indication Subscription NOTE: For more information, see the HP Systems Insight Manager 6.3 Installation and Configuration Guide for HP-UX at: http://www.hp.
1. Select All Events in the left pane of the HP SIM window. The list of events is displayed, as shown in Figure 4-11. Figure 12 Events list 2. To view the details of an event, select the event. The details are displayed at the bottom of the same window, as shown in Figure 4-12.
3. To obtain the printable version of the event details, click View Printable Details at the bottom of the window. The printable report is displayed in a new window, as shown in Figure 4-13.
Table 5 EMS, WBEM and Evweb Events Severity values (continued) EMS Severity WBEM Severity Evweb Severity 4 Serious 6 Critical 7 Critical 5 Critical 7 Fatal/Non-recoverable 7 Critical NOTE: Perceived Severities in Syslog is same as WBEM severities.
Table 7 Property Representation (continued) EMS Hardware Monitors EMS Wrapper Provider / Native Indication Provider Physical Device Path HWLogicalLocation InquiryProductID DeviceModel PhysicalDevicePath DeviceControllerLogicalLocation Table 8 Command Representation Task In EMS In SFM Deleting a monitoring request # /etc/opt/resmon/lbin/monconfig # evweb subscribe -D -f -n Sending a test event # # sfmconfig -t -
Table 10 Default Monitoring Requests for Each Monitor (continued) Default Notification Method Severity Levels SysFaultMgmt E-MAIL None Not Available Evweb DB All Available (evweb eventviewer -L) NOTE: The Severity Levels in Table 4-6 indicate WBEM Severity. For a list of WBEM indications generated by all the monitors, see the EMS Event Descriptions at: http://www.hp.com/go/hpux-diagnostics-online-events Table 11 (page 42) lists all the values as Status in sfmconfig -a -L.
1. On the System Page of HP SIM, click System Management Homepage, as shown in Figure 4–14. Figure 15 System Page The HP SMH home page is displayed. 2. Perform the relevant steps described in “Viewing Instances” (page 44).
5 Administering Indications and Instances Using HP SMH This chapter describes the SFM administration tasks that you can perform using HP SMH on a local system.
NOTE: Starting September 2009 release, in HP SMH GUI, you can refer to “The equivalent command line” option, to view command line information about processors. For more information, view cprop manpage. See "man cprop" 1. Select Show All under System on the HP SMH home page. The system page is displayed. Figure 16 System Management Homepage 2. Select Processors under System on the HP SMH home page. Information about the processors is displayed. 3. To return to the HP SMH home page, click on Home.
Viewing Information About System Summary To obtain information about system summary, such as the model, role, UUID, UUID (Logical), Serial number, Serial number (Logical) and many more, complete the following steps: 1. Select System Summary under System on the HP SMH home page. System summary information is displayed. 2. To return to the HP SMH home page, click on Home.
Viewing Information About Management Processor To obtain information about the Management Processor (MP), such as its IP address, status, and URL, complete the following steps: 1. Select Management Processor under System on the HP SMH home page. Information about the management processor is displayed. 2. To return to the HP SMH home page, click on Home.
1. Select Blade under System on the HP SMH home page. Information about the Blade is displayed. 2. To return to the HP SMH home page, click on Home. Viewing Information About Cell Blade To obtain information about the Cell Blade, such as the Status, Hardware Path and OA partition Information of the enclosures, complete the following steps: 1. Select Cell Blade under System on the HP SMH home page. Information about the Cell Blade is displayed. 2. To return to the HP SMH home page, click on Home.
For more information, see HP System Management Homepage Online Help. In HP SMH, go to the Help menu. Administering Indications Using Evweb This section provides an overview of Evweb and describes how to use Evweb for administrative tasks, such as creating and managing subscriptions for indications.
HPUXStorageNativeProviderModule These native indication provider support is available on the following platforms: • HP Integrity Server Blades BL860c i2 BL870c i2 BL890c i2 • HP Integrity rx2800 i2 server • HP Superdome 2 Launching Evweb for Administration You can launch Evweb either through the CLI or through the HP SMH GUI.
29). You cannot use the evweb list, evweb subscribe, or the evweb eventviewer command to create and delete Admin Defined event subscriptions. • Event subscriptions created using the HP SMH GUI (Event Subscription Administration) – You can create these event subscriptions using the GUI or the CLI. You can modify and delete the event subscriptions that are created using Event Subscription Administration.
• (-o ) • (-s ) • -r For more information on creating event subscriptions using CLI, see evweb_subscribe(1). Copying and Creating a New Event Subscription Using the GUI You can reuse the existing subscriptions to create another subscription. To create an event subscription by copying an existing event subscription, complete the following steps: 1. Repeat steps 1-5 from “Launching Evweb for Administration” (page 50). 2.
You can modify an event subscription in the following ways: • Modify a single event subscription. You can modify a single event subscription using the modify feature by selecting the event subscription from the event subscription table. • Modify similar criteria in multiple event subscriptions. You can modify similar criteria in multiple event subscriptions by using the Copy and Modify subscription feature.
If you specify only the subscription criteria and not the destination, then: • If you do not specify the -r option and the location, the current location is removed and the subscription criteria are updated. • If you specify the -r option but not the location, the current location is retained and only the subscription criteria are updated.
6. Select Modify in the Copy and modify subscription page. Evweb modifies the event subscriptions and displays a confirmation message. 7. Click OK on the confirmation message window. NOTE: The Copy and modify subscription feature is available only on the GUI. IMPORTANT: The subscription criteria are not copied when you copy an HP Advised event subscription. Therefore, ensure that you specify the subscription criteria in the Copy and modify subscription page.
NOTE: Using the CLI, you can delete only one event subscription at a time. For more information on deleting event subscriptions using the CLI, see evweb_subscribe(1). Configuring E-mail Consumer The E-mail Consumer is a component of Evweb that receives indications from the WBEM Services and redirects them to an SMTP server. Normally, the local system itself is the e-mail server. In such cases, you need not configure the E-mail Consumer.
Viewing a Summary of an Evweb Event Subscription Using the GUI To view a summary of the event subscriptions, repeat steps 1-5 from “Launching Evweb for Administration” (page 50). The Event Subscription Administration page is displayed. The Event Subscription Administration page displays a summary of the the event subscriptions, in a tabular format. In this document, this table is referred to as the Event Subscription Summary table.
Viewing Details of an Event Subscription Using the GUI To view details of an event subscription, complete the following steps: 1. Repeat steps 1-5 from “Launching Evweb for Administration” (page 50). The Event Subscription Administration page displays the Event Subscription Table. 2. Select the event subscription from the Event Subscription Table. The details of the event subscription is displayed at the end of the Event Subscription Table.
1. Repeat steps 1-5 from “Launching Evweb for Administration” (page 50). The Event Subscription Administration page displays the event subscription table. 2. Select View external subscription in the action pane on the top right corner of the page. The View external subscriptions page is displayed. For more information on viewing external event subscription using the HP SMH GUI, select Help on the action pane of the View External Event Subscription page.
This section addresses the following topics: • “Launching Evweb for Viewing WBEM Indications” (page 60) • “Searching for the Subscribed WBEM Events” (page 61) • “Viewing Summary Information About WBEM Events” (page 62) • “Viewing Detailed Information About WBEM Events” (page 62) • “Deleting WBEM Events from the Event Archive” (page 63) NOTE: Evweb enables both administrators and non-administrators to search and view WBEM events. However, only administrators can delete WBEM events.
Searching for the Subscribed WBEM Events Evweb enables you to search the Event Archive for subscribed WBEM events. The Evweb GUI provides a link, EMT Search, using which you can obtain error, cause, and recommended solutions for errors that may be generated on an HP-UX 11i v3 system. For more information about how to use EMT to search for WBEM events, see “Querying the Common Error Repository” (page 71).
• -o() -c() • -b [history|current] For information on searching the WBEM events using the CLI, see evweb_eventviewer(1). Viewing Summary Information About WBEM Events You can view summary information about events stored in the Event Archive database. Viewing Summary Information Using GUI To view summary information about WBEM events, repeat steps 1-5 from “Launching Evweb for Viewing WBEM Indications” (page 60). The List Events page is displayed.
For information on viewing detailed information of WBEM events using the CLI, see evweb_eventviewer(1). Deleting WBEM Events from the Event Archive You can delete a single event or multiple events at a time. Deleting an Event Using GUI To delete an event, complete the following steps: 1. Repeat steps 1-5 from “Launching Evweb for Viewing WBEM Indications” (page 60). 2. Select Delete Events in the action pane on the top right corner of the page. The Delete Events page is displayed. 3.
• “Searching Low Level Logs Using Advanced Search” (page 65) • “Viewing List of Low Level Logs” (page 66) • “Viewing Details of Low Level Logs” (page 67) Overview The low level log is required to view information about hardware details and system errors. The Log Viewer enables you to view low level log information from the log database on a local HP-UX system. The low level log information include Log Id, Log Index, Device Id, Device Type, and Time of occurrence.
4. Select Logs on the main menu. The Logs page is displayed. 5. Select Log Viewer in the Evweb box. The Log Viewer page is displayed. 6. 7. Provide appropriate information in the fields present in the Log Viewer page. Click Search on the Log Viewer page. Based on the search criteria, the log records are displayed in a tabular format. For information on searching the log database using GUI, select Help on the action pane of the Log Viewer page.
For information on searching for low level log information using the CLI, see evweb_logviewer(1). Viewing List of Low Level Logs You can view a list of low level logs summary using the Log Viewer. The list of low level logs are tabulated and include information, such as Log ID, Log Index, Device ID, Device Type, and Time of occurrence. In this document, this table is referred to as the Logs Summary Table. The Logs Summary Table is a result of the search operation.
Viewing Details of Low Level Logs You can view a details of low level logs using the Log Viewer. The detailed information about the low level logs include information, such as Log ID, Log Index, Log Type, Device ID, Device Type, Time of occurrence, and dump of the low level logs in hexadecimal format. Viewing Details Of Low Level Logs Using GUI To view details of low level logs using Log Viewer, complete the following steps: 1. Repeat steps 1-5 from “Searching Low Level Logs Using Simple Search” (page 64).
This section addresses the following topics: • “Enabling Tracing Using the Evweb GUI” (page 69) • “Enabling Tracing Using the Evweb CLI” (page 70) • “Modifying Tracing Using the Evweb GUI” (page 70) • “Modifying Tracing Using the Evweb CLI” (page 70) • “Disabling Tracing Using the Evweb GUI” (page 70) • “Disabling Tracing Using the Evweb CLI” (page 71) Tracing is a feature that enables you to log and report errors.
Table 16 Trace Levels (continued) Trace Level Description Example: The database server is not functioning properly or is down. 2-Error The system logs those situations that generate an error. Example: There is more than one subscription name. Evweb accepts only one subscription name. Critical situations are also logged at the Error trace level. 3-Warning The system logs situations that result in warning messages. Example: A warning is generated when the default setting is modified.
For more information on enabling tracing using the HP SMH GUI, select Help on the action pane of either the Event Viewer or the Event Subscription Administration page. Enabling Tracing Using the Evweb CLI To enable tracing using the Evweb CLI, you must export the environment variable, EVWEB_TRACE_LEVEL. To export the environment variable, enter the following command at the HP-UX prompt: # export EVWEB_TRACE_LEVEL= Tracing is now enabled. The trace value is the trace level that you have set.
3. Click Sign In on the login screen. The HP SMH home page is displayed. 4. Do one of the following: • Select Tools -> Subscription Administration. or • Select Logs -> Event Viewer. NOTE: 5. The Disable Tracing option is not displayed if tracing is not enabled. Select Disable Tracing available on the top right corner of the page. The tracing is disabled and a confirmation message is displayed. 6. Click OK on the confirmation message window.
The EMT supports the following user groups: • Administrator • Non-administrator In the CLI, any user with superuser privileges is an administrator. However, in the HP System Management Homepage (HP SMH) GUI, the user groups in EMT are mapped internally to the user groups defined in the HP SMH. The Administrator user group in the HP SMH maps to administrators in EMT. The Operator and the User user groups in the HP SMH map to non-administrators in EMT.
Querying CER for Events Using the CLI To query CER for events using the CLI, enter the following command at the HP-UX prompt: #emtui { -q [-w]} | { -i } Where: -q is an option that enables you to specify a query string to query the CER for information about errors, cause, and recommended actions. -w is an option that enables you to specify the match type. Following are the match types: -i • any (default) - Searches for at least one word specified in the query string.
The List Events page, which contains the Error Summary Table, is displayed. For information about viewing summary information of events in CER using the HP SMH GUI, select Help on the action pane of the List Events page. Viewing Summary Information Using the CLI To view summary information about events in CER using the CLI, enter the following command at the HP-UX prompt: # emtui -b Where: -b is an option used to view information about events in brief. A list of events in CER is displayed.
Adding a Custom Solution If you are a system administrator, you can add your own solution for an error generated on a HP-UX system. The custom solution is permanently stored in CER and is available to all EMT users. Adding a Custom Solution Using the GUI To add a custom solution using the HP SMH GUI, complete the following steps: 1. Repeat steps 1-5 from “Launching EMT” (page 72). 2. Search for the event from CER using either the Simple Search or the Advanced Search feature. 3.
3. If there is no cause associated with the event, skip to Step 4. If a cause is associated with the event, select the cause for the event from the Detailed Error Information (Administrative View) pane. You can select multiple causes for an event. 4. Click Modify Selected Solution on the right corner of the Detailed Error Information (Administrative View) pane. The Modify a Custom Solution page is displayed. 5.
# emtui -d -u Where: -d is an option used to delete a custom solution present in the CER. -u is an option used to specify the number associated with the custom solution that you want to delete. You can also use the following switches with the -m option: • -c • -i For information on deleting custom solution in the CER using the CLI, see emtui(1).
1. Repeat steps 1-5 from “Launching EMT” (page 72). NOTE: The Enable Tracing option is not displayed if tracing is already enabled. Instead, the Disable Tracing and the Modify Tracing option are displayed. 2. Select Enable Tracing on the top right corner of the page. The Enable Tracing page is displayed. 3. 4. Set the trace level by selecting the level from the trace level list. Select Enable Tracing. The tracing level is set and a confirmation message is displayed. 5.
3. Click OK on the confirmation message window. For more information about disabling tracing using the HP SMH GUI, select Help on the action pane of the Disable Tracing page. Disabling Tracing Using the EMT CLI To disable tracing using the EMT CLI, you must reset the trace value. To reset the trace value, enter the following command at the HP-UX prompt: # unset EMT_TRACE_LEVEL Tracing is now disabled. NOTE: Tracing is automatically disabled at the end of an EMT session.
6 Troubleshooting SFM This chapter describes how to troubleshoot SFM providers and EVWEB. This chapter addresses the following topics: • “Troubleshooting Instance Providers” (page 80) • “Troubleshooting Indication Providers” (page 85) • “Troubleshooting EVWEB” (page 90) NOTE: For information on issues with oserrorlogd, see the Using PSB Components section of the ProviderSvcsBase administrator guide.
Table 18 Troubleshooting Instance Providers (continued) Problem Cause Solution by entering the following command at the HP-UX prompt: On Itanium-based systems, enter: # ln -s /opt/sfm/lib/libsfmproviders.1\ /opt/wbem/providers/lib/libsfmproviders.so On PA-RISC-based systems, enter: # ln -s /opt/sfm/lib/libsfmproviders.1\ /opt/wbem/providers/lib/libsfmproviders.sl 7.
Table 18 Troubleshooting Instance Providers (continued) Problem Cause Solution Alternatively, you can enter the following command at the HP-UX prompt to start SFMProviderModule: # sh /opt/sfm/bin/restart_sfm.sh The logs to /var/opt/sfm/log/state.log are written when SFM is in Degraded State and is getting re-enabled by the script. NOTE: The script restarts SFM only if SFMProviderModule is in Degraded state. 3.
Table 20 Troubleshooting Instance Providers (continued) Problem: Requests for instances do not return any value. Causes Solution 3. If the output displayed is different from this output, the provider module is not registered. To register the provider module, enter the following command at the HP-UX prompt: # cimmof -nroot/PG_InterOp /opt/sfm/schemas/mof/SFMProvidersR.mof 4. If no errors are displayed, the provider module is registered successfully. Ignore this step and move to step 6.
Table 20 Troubleshooting Instance Providers (continued) Problem: Requests for instances do not return any value. Causes Solution 1. Enter the following command at the HP-UX prompt to disable SFMProviderModule: # cimprovider –d –m SFMProviderModule 2. Enter the following command at the HP-UX prompt to enable SFMProviderModule: # cimprovider –e –m SFMProviderModule Alternatively, you can enter the following command at the HP-UX prompt to start SFMProviderModule: # sh /opt/sfm/bin/restart_sfm.
Table 22 Troubleshooting Instance Providers (continued) Problem: Indications fulfilling the conditions defined in the HP-Known HP-Defined filters, are not logged in the Event Archive. Cause Solution To execute the file, enter the following command at the HP-UX prompt: # wbemexec /EnumerateInstances.xml The full path is the absolute path of the EnumerateInstances.xml file.
Table 24 Troubleshooting Indication Providers (continued) Problem: Indications corresponding to events generated by the Event Monitoring Service (EMS) monitors, are not logged in the Events List. Causes Solution # cimserver After the CIMOM restarts, enter the following command at the HP-UX prompt to register the provider module: # cimmof -nroot/PG_InterOp /opt/sfm/schemas/mof/SFMProvidersR.
Table 24 Troubleshooting Indication Providers (continued) Problem: Indications corresponding to events generated by the Event Monitoring Service (EMS) monitors, are not logged in the Events List.
Table 24 Troubleshooting Indication Providers (continued) Problem: Indications corresponding to events generated by the Event Monitoring Service (EMS) monitors, are not logged in the Events List. Causes Solution To enumerate instances, enter the following command at the HP-UX prompt: # wbemexec /enumerateInstances_sub.
Table 24 Troubleshooting Indication Providers (continued) Problem: Indications corresponding to events generated by the Event Monitoring Service (EMS) monitors, are not logged in the Events List. Causes Solution Cause 5 The indication providers are not loaded properly. To check if the indication providers are loaded properly, complete the following steps : 1. Open the /var/opt/sfm/conf/FMLoggerConfig.xml file. 2.
Table 24 Troubleshooting Indication Providers (continued) Problem: Indications corresponding to events generated by the Event Monitoring Service (EMS) monitors, are not logged in the Events List. Causes Solution If the status of SFMProviderModule is Degraded as displayed in the given output, SFMProviderModule is not running. To enable SFMProviderModule, complete the following steps: 1. Enter the following command at the HP-UX prompt to disable SFMProviderModule: # cimprovider –d –m SFMProviderModule 2.
Table 25 Troubleshooting EVWEB (continued) Problem Cause Solution The Event Archive Database service is not running properly. If the Event Archive Database service is running and the problem persists, check for error logs in the /var/opt/sfm/log/sfm.log file. For further assistance, contact the HP support center. WBEM Indications are not Cause 1 logged in to the Event SFMProviderModule is Archive. not running.
Table 25 Troubleshooting EVWEB (continued) Problem Cause Solution IPProviderModule SFMProviderModule OK Degraded If the status of SFMProviderModule is Degraded as displayed in the given output, SFMProviderModule is not running. To enable SFMProviderModule, complete the following steps: 1. Enter the following command at the HP-UX prompt to disable SFMProviderModule: # cimprovider –d –m SFMProviderModule 2.
Table 25 Troubleshooting EVWEB (continued) Problem Cause Solution Version C.06.00.07.01, 1. Delete the monitoring request using monconfig. Enter the September 2009 following command to delete the monitoring request: release, to provide a # /etc/opt/resmon/lbin/monconfig summary of event 2. Select the delete option to delete the request. information of critical and serious events. The (D)elete a monitoring request default subscription to 3.
A EMT Message Definition Following is a sample EMT Message file: $ Descriptor Header begins $ <> DescriptorID=0000023100000010800000AA006D2EA3 $ <> ProductName = myProduct $ <> ProductID = ID $ <> ProductEmailAlias=myproduct@abc.com $ <> OrgName = myorg $ <> OrgType = ISV $ <> Subsystem={(Type=EMS, Name= dm_chassis),(Type=WBEM, Name=FileSystemProvider)} $ <> ProductCategory=Kernel $ <> MsgCat={ID=1,(Path=./ lvmcommonmessages.cat, Locale= ja_JP.
Table 26 EMT Message File Description (continued) Tag Description Usage ProductCategory Specify one or more of the following product ProductCategory= categories that best describes your product: Kernel,IO,Network • Hardware • Network • IO • Kernel • Commands • Others MsgCat Specify a list of message catalogs. The MsgCat tag has the following attribute: ID – A unique number used to identify an error message. MsgCat={(ID=1, Path=../../../bin/cat/en_US.iso88591/module1.cat,LocaleName= en_US.
Table 26 EMT Message File Description (continued) Tag Description Usage only one cause and one or more corrective action for a given error message, the Action tags are associated with the Cause tag. In such a situation, the Cause_Action tag is not mandatory. For any error, a cause can be specified without specifying the corrective action. However, a corrective action cannot be specified without specifying a cause. WBEMDetail Specify WBEM specific details of a message.
B Interpretation of HP SMH Instances This appendix describes the fields and enables you to interpret the instances in the HP SMH property pages.
Processor Instances This section describes the processor instances. Figure 20 Sample Processors property page Table 27 (page 98) describes the fields and enables you to interpret the values displayed in Figure 20 (page 98). Table 27 Description of the Processors Fields and Values 98 Fields and Values Description Status Indicates the status of the processors. An OK status indicates that all the processors are functioning properly. Click Events to see the details of the errors.
Memory Instances This section describes the memory instances. Figure 21 Sample Memory property page Table 28 (page 99) and Table 29 (page 100) describes the fields and enables you to interpret the values displayed in Figure 21 (page 99). Table 28 Description of the Memory Slots Fields and Values Fields and Values Description Status Indicates the status of the memory module. An OK status indicates that all the modules are configured properly.
Table 28 Description of the Memory Slots Fields and Values (continued) Fields and Values Description Part Number Indicates the part number of the memory. HashID Identifies an instance of the device. Table 29 Description of the Empty Slots Fields and Values Fields and Values Description Location Indicates the location of the memory. Attributes such as Cabinet Number, Cell Slot, and DIMM Slot help narrow down the location of the memory module.
Table 30 Description of the Memory Slots Fields and Values (continued) Fields and Values Description Logical memory information Physical memory information Device Bay Information NOTE: Indicates the URL to launch the blade information page on the OA. Memory information displayed is as viewed from a hard partition (nPar).
System Summary Instances This section describes the system summary instances. Figure 23 Sample System Summary property page Table 31 (page 102), Table 32 (page 103) and Table 33 (page 103) describes the fields and enables you to interpret the values displayed in Figure 23 (page 102). Table 31 Description of the General Information Fields and Values Fields and Values Description Model Describes the system model.
Table 31 Description of the General Information Fields and Values (continued) Fields and Values Description UUID UUID (Logical) Universally Unique ID (UUID) indicates the asset number of the system. Indicates the UUID of the logical server. A logical server is a software configuration that can be applied to a server blade or a virtual machine. Also, you can move a logical server from one server blade or a virtual machine to another.
Cooling Device Instances This section describes the cooling device instances. Figure 24 Sample Cooling device property page Table 34 (page 104) describes the fields and enables you to interpret the values displayed in Figure 24 (page 104). Table 34 Description of the Cooling Device Fields and Values Fields and Values Description Status Indicates the status of the fans. An OK status indicates that all the modules are configured properly.
Power Supply Instances This section describes the power supply instances. Figure 25 Sample Power property page Table 35 (page 105) describes the fields and enables you to interpret the values displayed in Figure 25 (page 105). Table 35 Description of the Power Supply Fields and Values Fields and Values Description Status Indicates the status of the power supply. An OK status indicates that the power supplies are configured properly.
Temperature Instances This section describes the temperature instances. Figure 26 Sample Temperature property page Table 36 (page 106) describes the fields and enables you to interpret the values displayed in Figure 26 (page 106). Table 36 Description of the Temperature Fields and Values Fields and Values Description Status Indicates whether the sensor temperature in the system is normal or not. However, the status of the sensor temperature does not reflect the status of the cooling devices.
Voltage Instances This section describes the voltage instances. Figure 27 Sample Voltage property page Table 37 (page 107) describes the fields and enables you to interpret the values displayed in Figure 27 (page 107). Table 37 Description of the Voltage Fields and Values Fields and Values Description Status Indicates whether the sensor voltage in the system is normal or not. An OK status indicates that the sensor voltage in the system is normal. HashID Identifies an instance of the device.
FRU Information Instances This section describes the FRU Information instances. Figure 28 Sample FRU Information property page Table 38 (page 108) describes the fields and enables you to interpret the values displayed in Figure 28 (page 108). Table 38 Description of the MP Fields and Values Fields and Values Description Name Indicates the FRU Name of the Physical Element. Serial Number Indicates the serial number of the FRU. HashID Identifies an instance of the device.
Management Processor Instances This section describes the Management Processor (MP) instances. Figure 29 Sample MP property page Table 39 (page 109) describes the fields and enables you to interpret the values displayed in Figure 29 (page 109). Table 39 Description of the MP Fields and Values Fields and Values Description Status Indicates whether the Management Processor (MP) is functioning properly or not. An OK status indicates that the MP is functioning properly.
Firmware Information Instances This section describes the Firmware Information instances. Figure 30 Sample Firmware Information property page Table 40 (page 110) describes the fields and enables you to interpret the values displayed in Figure 30 (page 110). Table 40 Description of the Firmware Information Fields and Values 110 Fields and Values Description Name Indicates the name of the entity, such as the system firmware, MP, or the system backplane cell, whose firmware information is displayed.
Enclosure Information Instances This section describes the Enclosure instances. Figure 31 Sample Enclosure property page Table 41 (page 111) describes the fields and enables you to interpret the values displayed in Figure 31 (page 111). Table 41 Description of the Enclosure Information Fields and Values Fields and Values Description Status Indicates the status of the enclosure. An OK status indicates that the components of the enclosure are functioning properly.
Complex-wide Info Instances This section describes the Complex-wide Info instances. Figure 32 Sample Complex-wide Info property page Table 42 (page 113), Table 43 (page 113) and Table 44 (page 113) describes the fields and enables you to interpret the values displayed in Figure 32 (page 112).
Table 42 Description of the Complex Information Fields and Values Fields and Values Description Complex Name Describes user defined name for the complex. Model Defines Model identification string. Serial Number Indicates the serial number of the complex as assigned by the original manufacturer. Revision Displays string for the revision number of the profile, consisting of the major and minor revision numbers concatenated with a period as a separator.
Cell Board Instances This section describes the Cell Board instances. Figure 33 Sample Cell Board property page Table 45 (page 114) describes the fields and enables you to interpret the values displayed in Figure 33 (page 114). Table 45 Description of the Cabinet Fields and Values 114 Fields and Values Description Firmware Version Displays string for the firmware revision number, consisting of the major number separated from the minor number by a period. Status Indicates the status of the component.
Table 45 Description of the Cabinet Fields and Values (continued) Fields and Values Description Total Processor Slots Indicates the number of processor module slots on the cell. Total Empty Processor Slots Indicates the number of all empty processor slots. Processors Per Module Indicates the number of processors per processor module on the cell. Total Installed Processor Modules Indicates the number of all installed processor modules in the cell.
Partition Information Instances This section describes the Partition Information instances. Figure 34 Sample Partition Information property page Table 46 (page 116) describes the fields and enables you to interpret the values displayed in Figure 34 (page 116). Table 46 Description of the Partition Fields and Values 116 Fields and Values Description Partition Name Describes user defined name with the numeric label for the Partition. nPartition ID Indicates the ID of the nPartition in the complex.
Table 46 Description of the Partition Fields and Values (continued) Fields and Values Description Total Deconfigured Processor Modules Indicates the number of all deconfigured processor modules in the partition. Total Installed Memory Displays the total amount of memory installed in the partition, in megabytes. Total Installed Cells Indicates the number of all cells installed in the partition. Total Active Cells Indicates the number of all active cells in the partition.
Blade Instances This section describes the Blade instances. Figure 35 Sample Blade property page Table 47 (page 118) describes the fields and enables you to interpret the values displayed in Figure 35 (page 118). Table 47 Description of the Blade Fields and Values 118 Fields and Values Description Status Indicates the status of the blade. Hardware Path Indicates the hardware path of the blade. Serial Number Indicates the serial number of the blade.
Cell Blade Instances This section describes the Cell Blade instances. Figure 36 Sample Cell Blade property page Table 48 (page 119) describes the fields and enables you to interpret the values displayed in Figure 36 (page 119). Table 48 Description of the Cell Blade Fields and Values Fields and Values Description Status Indicates the status of the blade. Hardware Path Indicates the hardware path of the blade.
Launch the Onboard Administrator To access the Onboard Administrator (OA) from the property pages, complete the following steps: 1. Click on the Onboard Administrator link from the property page. Figure 37 Onboard Administrator 2. The OA login page opens in a new browser window. Figure 38 OA login page 3. Enter the Onboard Administrator User name and Password.
C Syslog property order This appendix describes the order for the properties (IndicationIdentifier, EventID, PerceivedSeverity, ProviderName and Summary) in the event message which is written in syslog by the HP_defaultSyslog subscription. NOTE: The term legacy refers to HP Integrity Servers with Intel(R) Itanium(R) processors older than 9300. The term HP Integrity Servers refers to Intel(R) Itanium(R) 9300 processors.
NOTE: Evweb writes more details into syslog for events encountered in the user system using the following option: # evweb subscribe -F Where: -F is an option used to create default syslog subscription. You can also use the following switches with the -F option: • -e [eq|ne|le|ge|bw] [:] [,] • (-w • -h For more information on evweb subscribe and its options, see the evweb_subscribe (1M) manpage.
Glossary A-B Admin-Defined event subscription Subscriptions created by the administrator using the CLI. These subscriptions cannot be deleted. Admin-Defined filters Filters that can be created, deleted, and modified to set the criteria for indications that must be logged. C Central Management Server (CMS) The server monitoring the client systems in the network using SFM. CIM client An entity in WBEM architecture which sends CIM Operation requests and receives CIM Operation responses.
External subscriptions These are subscriptions created by tools other than EVWEB. H HP System Management Homepage (HP SMH) HP's management application installed on the local system that uses WBEM instrumentation on operating systems such as HP-UX, Linux, and Windows. HP Systems Insight Manager (HP SIM) HP's management application installed on the CMS that uses WBEM instrumentation on operating systems such as HP-UX, Linux, and Windows.
subscription Configuring SFM for consumers to receive indications. For example, HP SIM could subscribe to indications generating on hardware devices on a system. SysFaultMgmt The name of the bundle that includes the SFM software. T-V Tracing Tracing is an error-logging and reporting facility provided by EVWEB and EMT. W-Z WBEM (Web-Based Enterprise Management) A collection of standards that aid large-scale systems management. WBEM allows management applications to monitor systems in a network.
Index A administrator, 49, 72 Autoselect dependency, 19 B benefits SFM, 7 C Central Management Server see CMS CER, 71 CIMOM, 16 cimserver, 80, 82, 83 -s option, 80, 82 cimserver -s, 80, 83 CMS, 15 command-line interface, 19 Common Information Model Object Manager see CIMOM configuration monitor mode, 30 SFM, 20 cooling devices on a system, 46 creation subscription, 32 cron, 15 custom solution adding, 75 deleting, 76 modifying, 75 D delete event subscription, 55 WBEM indication, 63 E Email Consumer confi
slview, 9 J jobid, 23 L Log Viewer, 64 Archive Log Database, 64 Current Log Database, 64 Logfile, 23 logs /var/opt/sfm/log/sfm.log file, 68, 77 /var/sam/log/samlog.log file, 69 M System Fault Management see SFM System Page of HP SIM, 43 T temperature status, 46 terminal user interface, 19 tracing, 67, 77 troubleshooting, 91 EMS Wrapper Provider, 87, 89 Event Archive, 90, 92 module, 86 V O /var/sam/log/samlog.
7 Support and other resources About This Document This document describes how to install, administer, and troubleshoot the System Fault Management (SFM) software and its components. Document updates may be issued between editions to correct errors or to document product changes. To ensure that you receive the updated or new editions, subscribe to the appropriate product support service. Contact your local HP sales representative for more information. This document can also be found online at: http://www.hp.
Chapter 5 Administering Indications and Instances Using HP SMH Describes how to use the HP System Management Homepage (HP SMH) GUI to administer indications and view instances on the local system. Chapter 6 Troubleshooting SFM Describes how to troubleshoot SFM providers and EVWEB. Appendix A Appendix A Describes the EMT message file. Appendix B Appendix B Interpretation of HP SMH Instances. Appendix C Appendix C Describes the Syslog property order.
New and changed information in this edition • The Table 3 (page 14) lists the Instance and Indication providers support on different platforms. • A new appendix, “ Syslog property order” (page 121) describes the order for the three properties (EventID, PerceivedSeverity and ProviderName) in the event message which is written in syslog by the HP_defaultSyslog subscription. Related Information Additional information about SFM is available at: http://www.hp.