System Fault Management Administrator’s Guide HP-UX 11i v2 HP Part Number: 5992-3900 Published: E0803
© Copyright 2008 Hewlett-Packard Development Company, L.P Legal Notices The information in this document is subject to change without notice. Hewlett-Packard makes no warranty of any kind with regard to this manual, including, but not limited to, the implied warranties of merchantability and fitness for a particular purpose.
Table of Contents About This Document ........................................................................................................9 Intended Audience.................................................................................................................................9 Publishing History..................................................................................................................................9 Document Organization.................................................
5 Administering Indications and Instances Using HP SMH........................................47 Viewing Instances.................................................................................................................................47 Viewing Information About Processors..........................................................................................47 Viewing Information About Physical Memory...............................................................................
Viewing List of Throttling Configuration Using GUI................................................................66 Viewing a List of Throttling Configuration Using CLI..............................................................66 Viewing Details of a Throttling Configuration...............................................................................66 Viewing Details of a Throttling Configuration Using GUI........................................................
Management Processor Instances.........................................................................................................93 Firmware Revision Instances................................................................................................................94 Enclosure Instances...............................................................................................................................94 Glossary..........................................................................
List of Figures 1-1 4-1 4-2 4-3 4-4 4-5 4-6 4-7 4-8 4-9 4-10 4-11 4-12 4-13 4-14 5-1 5-2 5-3 5-4 Block Diagram of SFM...................................................................................................................17 HP SIM Home Page.......................................................................................................................37 Global Protocol Settings................................................................................................................
List of Tables 1 2 1-1 1-2 3-1 4-1 4-2 4-3 5-1 5-2 5-3 5-4 5-5 A-1 A-2 A-3 A-4 A-5 A-6 A-7 A-8 A-9 A-10 8 Publishing History..........................................................................................................................9 HP-UX Releases.............................................................................................................................10 Instance Providers......................................................................................................
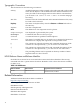
About This Document This document describes how to install, administer, and troubleshoot the System Fault Management (SFM) software and its components. Document updates may be issued between editions to correct errors or to document product changes. To ensure that you receive the updated or new editions, subscribe to the appropriate product support service. Contact your local HP sales representative for more information. This document can also be found online at: http://docs.hp.
Typographic Conventions This document uses the following conventions: audit(5) An HP-UX manpage. In this example, audit is the name and 5 is the section in the HP-UX Reference. On the Web and on the Instant Information CD, it may be a link to the manpage itself. From the HP-UX command line, you can enter “man audit” or “man 5 audit” to view the manpage. See man(1). Book Title The title of a book. On the Web and on the Instant Information CD, it may be a link to the book itself.
HP Welcomes Your Comments HP welcomes your comments concerning this document. We are truly committed to providing documentation that meets your needs. Send your comments or suggestions to:diag_lp@presskit.rsn.hp.com Include the document title, manufacturing part number, and any comment, error found, in this document. Also, please include what we did right, so we can incorporate it into other documents.
1 Introduction This chapter introduces you to the System Fault Management (SFM) software and the tools that SFM includes. The chapter discusses the following topics: • • • • • “Overview” (page 13) “Features and Benefits” (page 13) “Providers” (page 13) “User Interfaces” (page 16) “Architecture on PA-RISC and Itanium-based Systems” (page 16) Overview The SFM software is a collection of tools used to monitor the health of HP servers running HP-UX.
Instance Providers On request, an SFM instance provider dynamically queries the local or remote system for the property information described in Table 1-1 and reports the information to the CIMOM.
Table 1-1 Instance Providers (continued) Instance Provider Description Enclosure The Enclosure Instance Provider retrieves the following types of information: • Onboard Administrator (OA) description • OA IP address • OA MAC address • URL to launch the OA NOTE: The Enclosure Instance Provider is available on HP Integrity BL860c Server Blade and HP Integrity BL870c Server Blade only.
The SFMIndicationProvider is a standards-based solution that works independent of the EMS framework. The WBEM indications generated by the SFMIndicationProvider may contain additional data that are not present in the EMS event details. The WBEM indications can be reported to the EMS clients through the EMS framework. NOTE: The following apply to indication providers: • The terms events and indications are used interchangeably.
Figure 1-1 Block Diagram of SFM The sequence of events when a request is made for information of a managed resource is as follows: 1. 2. 3. 4. 5. The CIMOM receives requests from the CMS for device information. The CIMOM converts the requests to a format that is deciphered by the SFM providers and directs the requests to the appropriate SFM provider, for example, the CPU Instance Provider. The SFM provider queries the associated hardware device for property information.
1. 2. 3. The SFMIndicationProvider generates WBEM indications that are triggered by errors on devices that it monitors. The provider reports these WBEM indications to the CIMOM. The CIMOM directs these indications to Evweb and to the CMS that has created subscriptions for indications. Evweb then stores the indications either in the Event Archive or in your E-mail box, or both, depending on your configuration. Indications can be viewed using HP SIM on the remote system and HP SMH on the local system. 4.
2 Installing the SFM Software The System Fault Management (SFM) software is installed by default with the HP-UX 11i v2 Operating Environment (OE) media. However, at some point you may need to install the SFM software separately. This chapter describes how to install the SFM software as a standalone component on the HP-UX 11i v2 operating system.
Following is a co-requisite for using SFM: • PHKL_34795 IPMI patch NOTE: • SysMgmtWeb is optional. However, you can not access EVWEB GUI if SysMgmtWeb is not installed on the system. SysMgmtWeb, WBEMServices A.02.02.08, and Online Diagnostics are available on the Operating Environment (OE) media. • HP recommends that you install HP Systems Insight Manager (HP SIM) version C.05.01.00.01.xx to remotely administer indications and instances. • The mentioned versions of the software are minimum requirements.
6. Select Enforce dependency analysis errors in agent, and click OK, as shown in the following figure. The Note window is displayed. Selecting these options automatically installs all the dependencies. NOTE: The system selects some options by default. However, you must select the two options mentioned in step 5 to automatically install the prerequisites. 7. 8. Click OK in the Note window to confirm the selection of dependencies.
When the SFM software installs, the Install window appears indicating that the SFM software is installed successfully, as shown in the following figure: 9. Unmount the CD. To unmount, enter the following command at the HP-UX prompt: # unmount /tmp/cdrom 10.
2. Mount the CD to a location of your choice, as in the following example: # mount /dev/dsk/c1t2d0 /tmp/cdrom 3. To install the SFM software and all the dependencies, enter the following command at the HP-UX prompt: # swinstall -x autoselect_dependencies=true -x enforce_dependencies=true -s /tmp/cdrom SysFaultMgmt 4. Unmount the CD. To unmount, enter the following command at the HP-UX prompt: # unmount /tmp/cdrom 5.
The Logfile, which includes details about the installation, is displayed. If there are no errors in the Logfile, the SFM software is installed properly. If the SFM software is not installed properly, you must repeat the installation procedure. 3.
If the output contains no errors, the SFM software is installed properly. Otherwise, you must install the SFM software again. A sample output is shown in the following figure: 3. For information about installation-related errors, enter the following command at the HP-UX prompt: # swjob -a log @ :/ For example, enter the following command at the HP-UX prompt: # swjob -a log iemlhamia-0005 @ iemlhamia.india.hp.
4. Select Actions->Mark for Remove in the SD Remove window, as shown in the following figure: 5.
6.
7. When the SFM software is removed, the Remove Window is displayed, as shown in the following figure: 8. To verify whether the SFM software is removed properly, enter the following command at the HP-UX prompt: # swlist | grep SysFaultMgmt If the SFM software is removed properly, SysFaultMgmt and the version number of the SFM software does not appear in the output. If the SFM software is not removed properly, you must repeat the removal procedure.
3. To verify whether the SFM software is removed properly, enter the following command at the HP-UX prompt: # swlist | grep SysFaultMgmt If the SFM software is removed properly, SysFaultMgmt and the version number of the SFM software do not appear in the output. If the SFM software is not removed properly, you must repeat the removal procedure. For more information, see “Verifying Removal of the SFM Software” (page 29).
3 Configuring Indication Providers This chapter describes how to configure indication filters, error logging, and the SFMIndicationProvider. Configuring Indication Filters You must configure the indication filters to view desired indications. You use the Filter Metadata Provider (FMD) to configure indication filters that deliver important or desired indications, for example, indications with a certain severity.
Configuring Error Logging in SFM Logging information about the internal operational errors of SFM such as system call errors is called, error logging. You can configure error logging parameters, such as severity, location of logs, and the number of backup files by using the sfmconfig command. To configure these parameters, complete the following steps: 1. 2. Modify the /var/opt/sfm/conf/FMLoggerConfig.xml configuration file using a text editor. For the changes made in the /var/opt/sfm/conf/FMLoggerConfig.
To view the details of an event, enter the following command at the HP-UX prompt: # Evweb eventviewer -E -n The details of the specified event such as the summary, description, probable cause, and recommended actions for the error are displayed.
Table 3-1 Event Qualification for the SFMIndicationProvider (continued) Entry Description Available Values suppression time Time to suppress the generation of an event, in minutes. • NOT_USED - never suppress an event. • 1 - maxint - duration of suppression in minutes. • 9999999 - Generates an event only once. time window Threshold value of events, in • NOT_USED - threshold value not used. minutes.
# Evweb subscribe -C -n -e -v -t -g To modify a throttling configuration with a subscription, enter the following command at the HP-UX prompt: # Evweb subscribe -M -n -g To create, modify, and delete custom subscriptions using the GUI, see “Administering Throttling Configuration Policy Using Evweb” (page 61)“Administering Throttling Configuration Policy” on page 110.
4 Administering Indications and Instances Using HP SIM This chapter describes System Fault Management (SFM) administration on a remote system using HP Systems Insight Manager (HP SIM). NOTE: You can perform similar tasks using other management applications that are compliant with the Common Information Model (CIM) (2.7.2) schema of the Distributed Management Task Force (DMTF). The terms events and indications are used interchangeably in this document.
The Global Protocol Settings window is displayed, as shown in Figure 4-2. Figure 4-2 Global Protocol Settings 3. 4. In Figure 4-2, under Default WBEM settings, select Enable WBEM. Click OK to save your settings. Select Configure->Configure or Repair Agents, as shown in Figure 4-3. Figure 4-3 Configuration The Configure or Repair Agents window is displayed, as shown in Figure 4-4.
Figure 4-4 Configure or Repair Agents 5. From the Add targets by selecting from: list in Figure 3-4, select All Systems to view and select the systems. Selecting the name of the system enables you to view indications occurring on the selected system. The list of systems is displayed in the Select Target Systems window, as shown in Figure 4-5.
6. To select all the systems in the network, select the Select “All Systems” itself check box, as shown in Figure 4-5. Click Apply. The Verify Target Systems window is displayed, as shown in Figure 4-6. Figure 4-6 Verify Target Systems 7. Select the appropriate check box to verify the target systems and click Next, as shown in Figure 4-6. The Enter Credentials window is displayed, as shown in Figure 4-7.
8. Enter your credentials in the given fields, as shown in Figure 4-7. Click Next. The Configure or Repair Settings window is displayed, as shown in Figure 4-8. Figure 4-8 Configure or Repair Settings 9. On the Configure or Repair Settings window, click Run Now. The Task Results window is displayed, as shown in Figure 4-9. The Task Results window states that the Indication Subscription is successfully created.
10. To obtain a printable report of the indication subscription details, click View Printable Report. The report is displayed, as shown in Figure 4-10. Figure 4-10 Printable Report of the Indication Subscription NOTE: For more information, see the HP Systems Insight Manager Installation and User’s Guide at: http://docs.hp.com/en/netsys.
1. Select All Events in the left pane of the HP SIM window. The list of events is displayed, as shown in Figure 4-11. Figure 4-11 Events list 2. To view the details of an event, select the event. The details are displayed at the bottom of the same window, as shown in Figure 4-12.
3. To obtain the printable version of the event details, click View Printable Details at the bottom of the window. The printable report is displayed in a new window, as shown in Figure 4-13. Figure 4-13 Printable Event Details To create subscriptions and view indications using the CLI, see “Creating Event Subscription Using CLI” (page 53)“Creating Event Subscription Using CLI” on page 93. The ProviderName in the Event Details window indicates the monitor that generated the event.
Table 4-2 compares the EMS Hardware Monitors properties with the equivalent EMS Wrapper Provider properties.
Viewing Instances To view information about processors, physical memory, cooling devices, power supplies, and disks, complete the following steps: 1. On the System Page, select System Management Homepage, as shown in Figure 4–14. Figure 4-14 System Page The HP SMH home page is displayed. 2. 46 Perform the relevant steps described in “Viewing Instances” (page 47).
5 Administering Indications and Instances Using HP SMH This chapter describes the SFM administrative and non-administrative tasks that you can perform using HP SMH on a local system.
1. Select 6 items not shown under System on the HP SMH home page. The system page is displayed. Figure 5-1 System Management Homepage 2. Select Processors under Summary on the HP SMH home page. Information about the processors is displayed. 3. To return to the HP SMH home page, click Home at the top of the window. NOTE: There is no CLI to view information about processors.
NOTE: There is no CLI to view information about memory. For more information on how to interpret the physical memory instances' fields and the corresponding values, see “Physical Memory Instances” (page 88) Viewing Information About Cooling Devices To view information about the cooling devices on the system, such as the status, location, and the type of fans, complete the following steps: 1. Select Cooling under System on the HP SMH home page.
2. Select Voltage on the system page. The voltage status of the system and the events related to voltage are displayed in the Voltage Status window. 3. To return to the HP SMH home page, click Home at the top of the window. NOTE: There is no CLI to view information about the voltage status.
NOTE: For more information on how to interpret the enclosure instances' fields and the corresponding values, see “Enclosure Instances” (page 94) Administering Indications Using Evweb This section describes how to use Evweb for administrative tasks, such as creating and managing subscriptions for indications.
To use HP SMH GUI to launch Evweb for administering event subscription, complete the following steps: 1. Log in to HP SMH. To log in to HP SMH, enter http://: 2301 in the address bar of the Web browser. The HP SMH login screen is displayed. 2. 3. Enter your user name and password in the appropriate text boxes. Click Sign In on the login screen. The HP SMH home page is displayed. 4. Select Tools in the main menu. The Tools page is displayed.
NOTE: It is mandatory to specify a unique name for creating an event subscription. NOTE: In the EMS hardware monitoring mode, by design, Evweb associates the default throttling configuration with the subscription. As a result, user defined throttling configurations are not effective. 4. 5. To view the command line equivalent of creating event subscriptions using GUI, click Preview on the Create Subscription page. This step is optional. Select Create on the Create Subscription page.
5. NOTE: In the EMS hardware monitoring mode, by design, Evweb associates the default throttling configuration with the subscription. As a result, user defined throttling configurations are not effective. IMPORTANT: The subscription criteria is not copied when you copy an HP Advised event subscription. Therefore, ensure that you specify the subscription criteria in the Copy and Create Subscription page. 6. Select Create. Evweb creates the event subscription and displays a confirmation message. 7.
NOTE: You can modify a throttling configuration in both EMS and SFM hardware monitoring mode. However, In the EMS hardware monitoring mode, only the default throttling configuration is effective. 5. 6. To view the command line equivalent of modifying event subscriptions using GUI, click Preview on the Modify subscription page. This step is optional. Select Modify in the Modify subscription page. Evweb modifies the event subscription and displays a confirmation message. 7.
1. 2. Repeat steps 1-5 from “Launching Evweb for Administration” (page 51). Select the event subscriptions you want to copy, from the event subscription table. The copy and modify subscription page is displayed. 3. 4. Select the event subscriptions you want to modify by selecting the respective check boxes. Select Copy and modify subscription in the action pane on the top right corner of the page. The Copy and modify subscription page is displayed. 5. Modify the required fields.
NOTE: HP recommends deleting all unwanted event subscriptions. Retaining a large number of event subscriptions may increase the size of the archive, and may affect the tasks you perform using Event Subscriptions Administration. Deleting an Event Subscription Using CLI To delete an event subscription using the CLI, enter the following command at the HP-UX prompt: # Evweb subscribe -D -f -n NOTE: The -n switch is mandatory. Where: -D is an option used to delete event subscriptions.
3. Enter the following command at the HP-UX prompt: # sfmconfig -c /var/opt/sfm/conf/Evweb.conf The following message is displayed at the HP-UX prompt: loaded the control provider The E-mail Consumer is successfully configured. Viewing Event Subscriptions Using Evweb This section describes how to perform non-administration tasks, such as viewing event subscriptions.
A summary of event subscriptions is displayed in a tabular format, as shown in Figure 5-2. Figure 5-2 Summary of Evweb Event Subscriptions Table 5-1 describes the various fields in the Event Subscription Summary table. Table 5-1 Evweb Event Subscriptions Field Description Subscription Name Displays the name of an event subscription. HP Known Displays TRUE if the subscription is HP Known. Displays FALSE if the subscription is not HP Known.
Figure 5-3 Details of an Event Subscription Table 5-2 describes the various fields in the Details of an Event Subscription page. Table 5-2 Details of an Event Subscriptions Field Description Subscription Name Displays the name of an event subscription. Throttling Config Name Displays the name of the throttling configuration that is associated with the subscription. Subscription Criteria Displays the criteria that are specified for the subscription.
-b is a switch used to display information about event subscriptions in brief. external is an argument used to display information about external event subscriptions. A list of event subscriptions is displayed in a tabular format, as shown in Figure 5-4. Figure 5-4 External Event Subscriptions The field names of the external event subscriptions are different from the ones created using Evweb.
You can create a throttling configuration in both EMS and SFM hardware monitoring mode. However, In the EMS hardware monitoring mode, the association of a throttling configuration with a subscription is not effective. By design, in the EMS hardware monitoring mode, Evweb associates the default throttling configuration with a subscription. Creating a Throttling Configuration Using GUI To create a throttling configuration, complete the following steps: 1. 2.
Copying Throttling Configuration Policy to a File You can copy an existing throttling configuration to a new file. You can modify the parameters in the new file to create a new throttling configuration policy file. You can use this policy file to create and modify a throttling configuration. NOTE: In the EMS hardware monitoring mode, only the default throttling configuration is effective.
You cannot modify HP Known throttling configurations. In all other throttling configurations, you cannot modify the name of the throttling configuration. In the EMS hardware monitoring mode, by design, Evweb associates the default throttling configuration with the subscription. As a result, user defined throttling configurations are not effective. Modifying a Throttling Configuration Using GUI To modify a throttling configuration, complete the following steps: 1. 2.
Deleting Throttling Configuration You must periodically delete throttling configurations that are not required. You can delete a single throttling configuration or multiple throttling configurations at a time. Deleting a Throttling Configuration Using GUI To delete a throttling configuration, complete the following steps: 1. 2. Repeat steps 1-5 from “Launching Evweb for Administration” (page 51). Select Manage Throttling Configurations in the action pane on the top right corner of the page.
NOTE: The Throttling configuration administration feature is available only on Integrity servers. This feature is not available on HP 9000 servers. Overview The Event Subscription Administration enables you to manage throttling configurations on a local HP-UX system. The Manage throttling configuration page displays a list of throttling configuration in a tabular format. In this document, this table is referred to as Throttling Configuration Summary Table.
3. Select the throttling configuration from Throttling Configuration Summary Table. The details of the throttling configuration appear at the end of Throttling Configuration Summary Table. For more information on viewing the details of a throttling configuration using the HP SMH GUI, select Help on the action pane of the Manage throttling config page.
The events stored in the Current Event Archive are automatically moved to the History Event Archive based on the following parameters, which ever occurs first: • • • The events are older than 10 days. The page size of the Current Event Archive is greater than 100. Events older than 365 days are purged from the History Event Archive. This results in a phased elimination of old events. Launching Evweb for Viewing WBEM Indications You can launch Evweb either through the CLI or the GUI.
2. Select Advanced Search on the right pane of the Event Viewer page. The Advanced Search page is displayed. 3. 4. Provide appropriate information in the text boxes and fields present in the Advanced Search page. Click Search on the Advanced Search page. Based on the search criteria, the WBEM events are displayed in a tabular format in the Event Viewer page. For more information on searching for WBEM events using GUI, select Help on the action pane of the Advanced Search page.
-f is an optional switch used to force the command. The -f switch can be used only with the -x switch. A list of WBEM events is displayed on the screen. Viewing Detailed Information About WBEM Events You can view the details of an WBEM event using Evweb. The details of an event appear at the end of the List Events table only when you select an event from the List Events table. Viewing Detailed Information Using GUI To view detailed information about WBEM events, complete the following steps: 1. 2.
Deleting an Event Using CLI To delete WBEM events using CLI, enter the following command at the HP-UX prompt: # Evweb eventviewer -D Where: -D is an option used to delete all the WBEM events.
3. Click Sign In on the login screen. The HP SMH home page is displayed. 4. Select Logs on the main menu. The Logs page is displayed. 5. Select Log Viewer in the Evweb box. The Log Viewer page is displayed. 6. 7. Provide appropriate information in the fields present in the Log Viewer page. Click Search on the Log Viewer page. Based on the search criteria, the log records are displayed in a tabular format.
NOTE: The -a and the -t switches are mutually exclusive and can be used with the -L option only. • • -s[asc|desc] -o -c NOTE: The -s, -o,and the -c switches can be used with the -L option only. For information on searching for low level log information using the CLI, see Evweb_logviewer(1). Viewing List of Low Level Logs You can view a list of low level logs summary using the Log Viewer.
NOTE: The -s, -o,and the -c switches can be used with the -L option only. For information on viewing a list of low level logs using the CLI, see Evweb_logviewer(1). Viewing Details of Low Level Logs You can view a details of low level logs using the Log Viewer. The detailed information about the low level logs include information, such as Log ID, Log Index, Log Type, Log Source, Log Version, Device ID, Device Type, Log Version, Time of occurrence, and Buffer.
sfm.log. The default location of the sfm.log file is /var/opt/sfm/log/sfm.log. You can send these log files to the HP support center whenever you encounter a problem. Following is a sample of the information logged in sfm.log. 01/04/06 06:50:08 EVMAN_COMMANDS ERROR 1069627450 1 Subscription with this name already exist, Please choose different name and try again. Table 5-4 describes the various fields included in the sfm.log file. Table 5-4 Entries in sfm.
NOTE: Tracing is available for administrators only. However, non-administrators can view the trace files. Enabling Tracing Using Evweb GUI To enable tracing, complete the following steps: 1. Log in to the System Management Homepage. To log in to HP SMH, enter http://: 2301 in the address bar of a Web browser. The HP SMH login screen is displayed. 2. 3. Enter your user name and password in the appropriate text boxes. Click Sign In on the login screen. The HP SMH home page is displayed. 4.
4. Do one of the following: • Select Tools -> Subscription Administration. or • 5. Select Logs -> Event Viewer. Select Modify Tracing available at the top right corner of the page. The Modify Tracing page is displayed. NOTE: 6. 7. The Modify Tracing option is not displayed if tracing is not enabled. Change the trace level by selecting the level in the Trace Level list. Select Modify Tracing. The tracing level is modified and a confirmation message is displayed. 8.
# unset Evweb_TRACE_LEVEL Tracing is now disabled. NOTE: 78 Tracing is automatically disabled at the end of an Evweb session.
6 Troubleshooting SFM This chapter describes how to troubleshoot SFM providers and Evweb. This chapter addresses the following topics: • “Troubleshooting Instance Providers” (page 79) • “Troubleshooting Indication Providers” (page 81) • “Troubleshooting Evweb” (page 85) Troubleshooting Instance Providers This section describes techniques for troubleshooting instance providers, such as the CPU Instance Provider, Memory Instance Provider, Filter Metadata (FMD) Provider, and Environmental Providers.
Solution Enter the following command at the HP-UX prompt: # cimprovider -ls | grep SFMProviderModule If the following output is displayed, all the providers are registered properly: SFMProviderModule OK If the output displayed is different from this output, the provider module is not registered. To register the provider module, enter the following command at the HP-UX prompt: # cimmof -nroot/PG-InterOp /opt/sfm/schemas/mof/SFMProvidersR.
Troubleshooting Indication Providers This section describes the techniques for troubleshooting the EMS Wrapper Provider and the SFMIndicationProvider. NOTE: The SFMIndicationProvider is available on Itanium-based systems only. The SFMIndicationProvider generates WBEM indications only if you choose to use it. Otherwise, the EMS monitors generate EMS events. These events are converted into WBEM indications by the EMS Wrapper Provider.
# ln -s /opt/sfm/lib/libsfmproviders.1 /opt/wbem/providers/lib/libsfmproviders.so On PA-RISC-based systems, enter: # ln -s /opt/sfm/lib/libsfmproviders.1 /opt/wbem/providers/lib/libsfmproviders.sl To check whether the link is created, enter the following command at the /opt/wbem/providers/lib directory: # ls Following is a sample output indicating that the link is created: On Itanium-based systems: # lrwxr-xr-x 1 root sys 30 Jan 12 06:56 libsfmproviders.so -> /opt/sfm/lib/libsfmproviders.
Cause 4 Subscriptions do not exist. Solution Complete the following steps: 1. Enter the following command at the HP-UX prompt to check if subscriptions exist: # Evweb subscribe -L -b external If subscriptions exist, contact your local HP support personnel. Otherwise, proceed to step 2 2.
NOTE: You can create sample indications using only those monitors that are supported on your system. For the list of monitors supported on your system, see the EMS Wrapper Provider Data Sheet posted at: http://docs.hp.com/en/diag 5. Open the /var/opt/sfm/log/sfm.log file. NOTE: The /var/opt/sfm/log/sfm.log file is the file specified in the Target field of the FMLoggerConfig.xml file. Following is an example of how the sfm.
Troubleshooting Evweb Problem While you are deleting an event stored in the Event Archive, the following error message is displayed: An error occurred while deleting the event. Cause Evweb is unable to delete an event from the Event Archive. The Event Archive Database service is not running properly.
To check the status of the SFM provider module, enter the following command at the HP-UX prompt: # cimprovider -ls | grep SFMProviderModule If the SFM provider module is disabled, enter the following command at the HP-UX prompt to enable the Event Archive Consumer: # /opt/wbem/bin/cimprovider -e -m SFMProviderModule If the Event Archive Consumer is enabled and the indications are still not logged in the Event Archive, check for error logs in the /var/opt/sfm/log/sfm.log file.
A Interpretation of HP SMH Instances This appendix describes the fields and enables you to interpret the instances in the HP SMH property pages.
Table A-1 Description of the Processor Fields and Values Fields and Values Description Status Indicates the status of the processors. An OK status indicates that all the processors are functioning properly. In Figure A-1, eight instances indicate that the system has eight single core processors or four dual core processors. They also indicate that four processors are in the dormant state. Click Events to see the details of the errors. Cabinet Number Indicates the cabinet that contains the processors.
Table A-2 Description of the Physical Memory Fields and Values Fields and Values Description Status Indicates the status of the physical memory module. An OK status indicates that all the modules are configured properly. If the status of the physical memory module indicates an error, click Events to see the details of the errors. In Figure A-2, eight instances indicate that the system has eight physical memory modules. Cabinet Number Indicates the cabinet that contains the memory modules.
Table A-3 Description of the Cooling Device Fields and Values Fields and Values Description Status Indicates the status of the fans. In Figure A-3, four instances indicate that there are four fans and that all of them are within a single cabinet. Also, the status of all the fans is OK. If the status of a cooling device indicates an error, see the details of the error using Event Viewer. Location Indicates the physical location of the fans. Fan Type Indicates the type of the fan.
Temperature Instances This section describes the temperature instances. Figure A-5 shows a sample temperature property page. Table A-5 describes the fields and enables you to interpret the values displayed in Figure A-5. Table A-5 Description of the Temperature Fields and Values Fields and Values Description Status Indicates whether the sensor temperature in the system is normal or not. However, the status of the sensor temperature does not reflect the status of the cooling devices.
Table A-6 describes the fields and enables you to interpret the values displayed in Figure A-6. Table A-6 Description of the Voltage Fields and Values Fields and Values Description Status Indicates whether the sensor voltage in the system is normal or not. In Figure A-6, the sensor voltage in the system is normal. List Events Lists the events related to the voltage devices in the system. Disk Drive Instances This section describes the disk drive instances.
Table A-7 describes the fields and enables you to interpret the values displayed in Figure A-7. Table A-7 Description of the Disk Drive Fields and Values Fields and Values Description Status Indicates whether the disk drives are functioning properly or not. In Figure A-7, there are two disks and the status of both the disks is OK. If the status of a disk indicates an error, see the details of the error using Event Viewer. Hardware Path Indicates the physical location of the disks.
Table A-8 Description of the MP Fields and Values Fields and Values Description Status Indicates whether the Management Processor (MP) is functioning properly or not. In Figure A-8, the status of the MP is OK. IP Address Indicates the IP address of the MP controller. URL Indicates the URL to launch the MP Integrated Lights Out (ILO) interface. State Indicates whether the MP is enabled or not. Firmware Revision Instances This section describes the Firmware Revision instances.
Table A-10 describes the fields and enables you to interpret the values displayed in Figure A-10. Table A-10 Description of the Enclosure Information Fields and Values Fields and Values Description Status Indicates the status of the enclosure. An OK status indicates that the components of the enclosure are functioning properly. If the status of an enclosure indicates an error, see the details of the error using Event Viewer. Rack Name Indicates the name of the rack.
Glossary A-B Admin-Defined event subscription Subscriptions created by the administrator using the CLI. These subscriptions cannot be deleted. Admin-Defined filters Filters that can be created, deleted, and modified to set the criteria for indications that must be logged. C Central Management Server (CMS) The server monitoring the client systems in the network using SFM. CIM client An entity in WBEM architecture which sends CIM Operation requests and receives CIM Operation responses.
F-G fmControl The command used to configure software error logging parameters. fmdcontrol The command used to create, delete, and modify Admin-Defined filters. H HP System Management Homepage (HP SMH) HP's management application installed on the local system that uses WBEM instrumentation on operating systems such as HP-UX, Linux, and Windows.
subscription Configuring SFM for consumers to receive indications. For example, HP SIM could subscribe to indications generating on hardware devices on a system. SysFaultMgmt The name of the bundle that includes the SFM software. T-V Tracing Tracing is an error-logging and reporting facility provided by Evweb. W-Z WBEM (Web-Based Enterprise Management) A collection of standards that aid large-scale systems management. WBEM allows management applications to monitor systems in a network.
Index A administrator, 51 Autoselect dependency, 20 B benefits SFM, 13 C Central Management Server (see CMS) CIMOM, 17 cimserver, 79, 80 -s option, 79 command-line interface, 20 Common Information Model Object Manager (see CIMOM) configuration SFM, 21 SFMIndicationProvider, 32 cooling devices on a system, 49 creation subscription, 37 viewing external event subscription, 60 Evweb, 51 CLI, 51, 68 component, 51 GUI, 51, 68 local administration, 51 tracing, 74 user interface, 51 using CLI, 51 using GUI, 52
N V non-administrator, 51 /var/sam/log/samlog.log file, 75 verify SFM, 22 view Evweb event subscription, 58, 59 external event subscription, 60 WBEM indication, 69 view indications, 39 voltage status, 49 O /var/opt/sfm/conf/Evweb.