
C and C++ SoftBench User's Guide

Maximizing Your Results with SoftBench
Using the SoftBench Integrated Environment
Chapter 1 33
show you pictures of your code structure.
SoftBench Debugger
Monitor your program's execution with SoftBench
Debugger. You can set breakpoints, trace function calls,
and watch variable values to isolate defects in your
code. Data Graph Window gives you a visual image of
your data structures as they change.
SoftBench File Compare
Compare two versions of a file and select lines from
each to create a merged file using SoftBench File
Compare.
SoftBench Message Monitor
Watch SoftBench internal messages between tools to
assist in isolating problems with SoftBench and to
debug the integration of new tools into the SoftBench
environment.
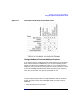
Figure 1-8 Using SoftBench Tools Throughout Your Development Cycle