
C and C++ SoftBench User's Guide

Using SoftBench Debugger Data Graph Window
Sample Use Models
Chapter 8 245
Sample Use Models
This section introduces you to several Data Graph Window concepts
useful in verifying the correct or expected operation of your program's
data structures. By setting strategic breakpoints and selecting the
pointer dereferencing commands, you can quickly visualize what
happens to your data structures during program execution. Using the
Data Graph Window increases your program understanding and
decrease your defect isolation time.
The following scenario assumes you have a defect in your program,
which contains binary trees implemented with pointers. These use
models provide scenarios for:
• Visually picturing the data structures, by graphing the overall
connections within a large interconnected data structure.
• Displaying values of data members within the structures represented
by nodes on the Data Graph Window.
The source for the example used in this section is found in
/opt/softbench/examples/bintree/bintree.C.
Verifying Correct Data Structures
Suppose that your program has a binary tree defined by the variable
btree. At some breakpoint during execution of the program, assume you
want to see the state of the binary tree.
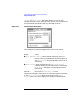
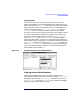
Viewing btree
To see the binary tree in the Data Graph Window, you would enter btree
in the "()" input box and choose "Show: Data Graph ( )". The Data
Graph Window opens, displaying a single node representing the btree
variable. The node is labeled (btree) with the type class
\\BinaryTree.
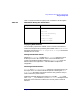
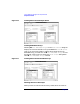
To follow all the pointers in btree, you would select the node and select
"Follow All" from the "Selected" menu. SoftBench Debugger
dereferences all non-NULL pointers in btree and adds new nodes to the
Data Graph Window for each pointer. In this model, one node is added of
type class TreeNode.