
C and C++ SoftBench User's Guide

Using SoftBench Debugger Data Graph Window
Understanding Data Graph Window Areas
Chapter 8240
Reading Arcs
Arcs represent pointers from one structure to another. The arc label is
the name of the pointer, if named. You can toggle "■ Show Arc Labels"
to display or hide the arc labels.
Using Dialog Boxes
The popup menu selection "Show Node Values" enables the "Node
Values" dialog box, which displays the data members (including arrays)
within a particular structure and their values.
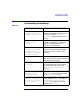
Understanding the Window Control Area
The Window Control Area at the bottom of the Data Graph Window
includes "Queue Length" information and push buttons:
Queue Length The Queue Length status indicates how many internal
graph operations are pending. This gives you feedback
about how your request is proceeding. Be aware that
this number can increase and decrease as new
operations are added to and removed from the queue.
Stop Stop is active when the number of operations in the
queue is greater than one (otherwise greyed out). As
SoftBench Debugger processes each operation, it
checks to see if this button has been pressed. When
selected, SoftBench Debugger deletes the pending
operations, halts the operation in progress, and
displays partial results in the Graph Area.
Close When selected, the Data Graph Window closes. The
Escape key is bound to this button. The Close button on
the window manager frame also closes the window.
When you close the Data Graph Window, SoftBench
Debugger discards all the graphed data.